Author: Ph.D. Candidate Chihyeon Kim, Hanyang University, EIDL (Electromagnetics Intelligent Design Lab)
This notebook demonstrates the design and simulation of a cascaded 2×2 MMI array using an eigenmode expansion (EME) approach in Tidy3D.
The workflow includes layout generation using Photonforge, EME grid construction, mode validation, and extraction of transmission and reflection coefficients in the physical port basis.
The device geometry follows Zhang et al., Optics Letters 45.4 (2020): 811–814. https://doi.org/10.1364/OL.384771
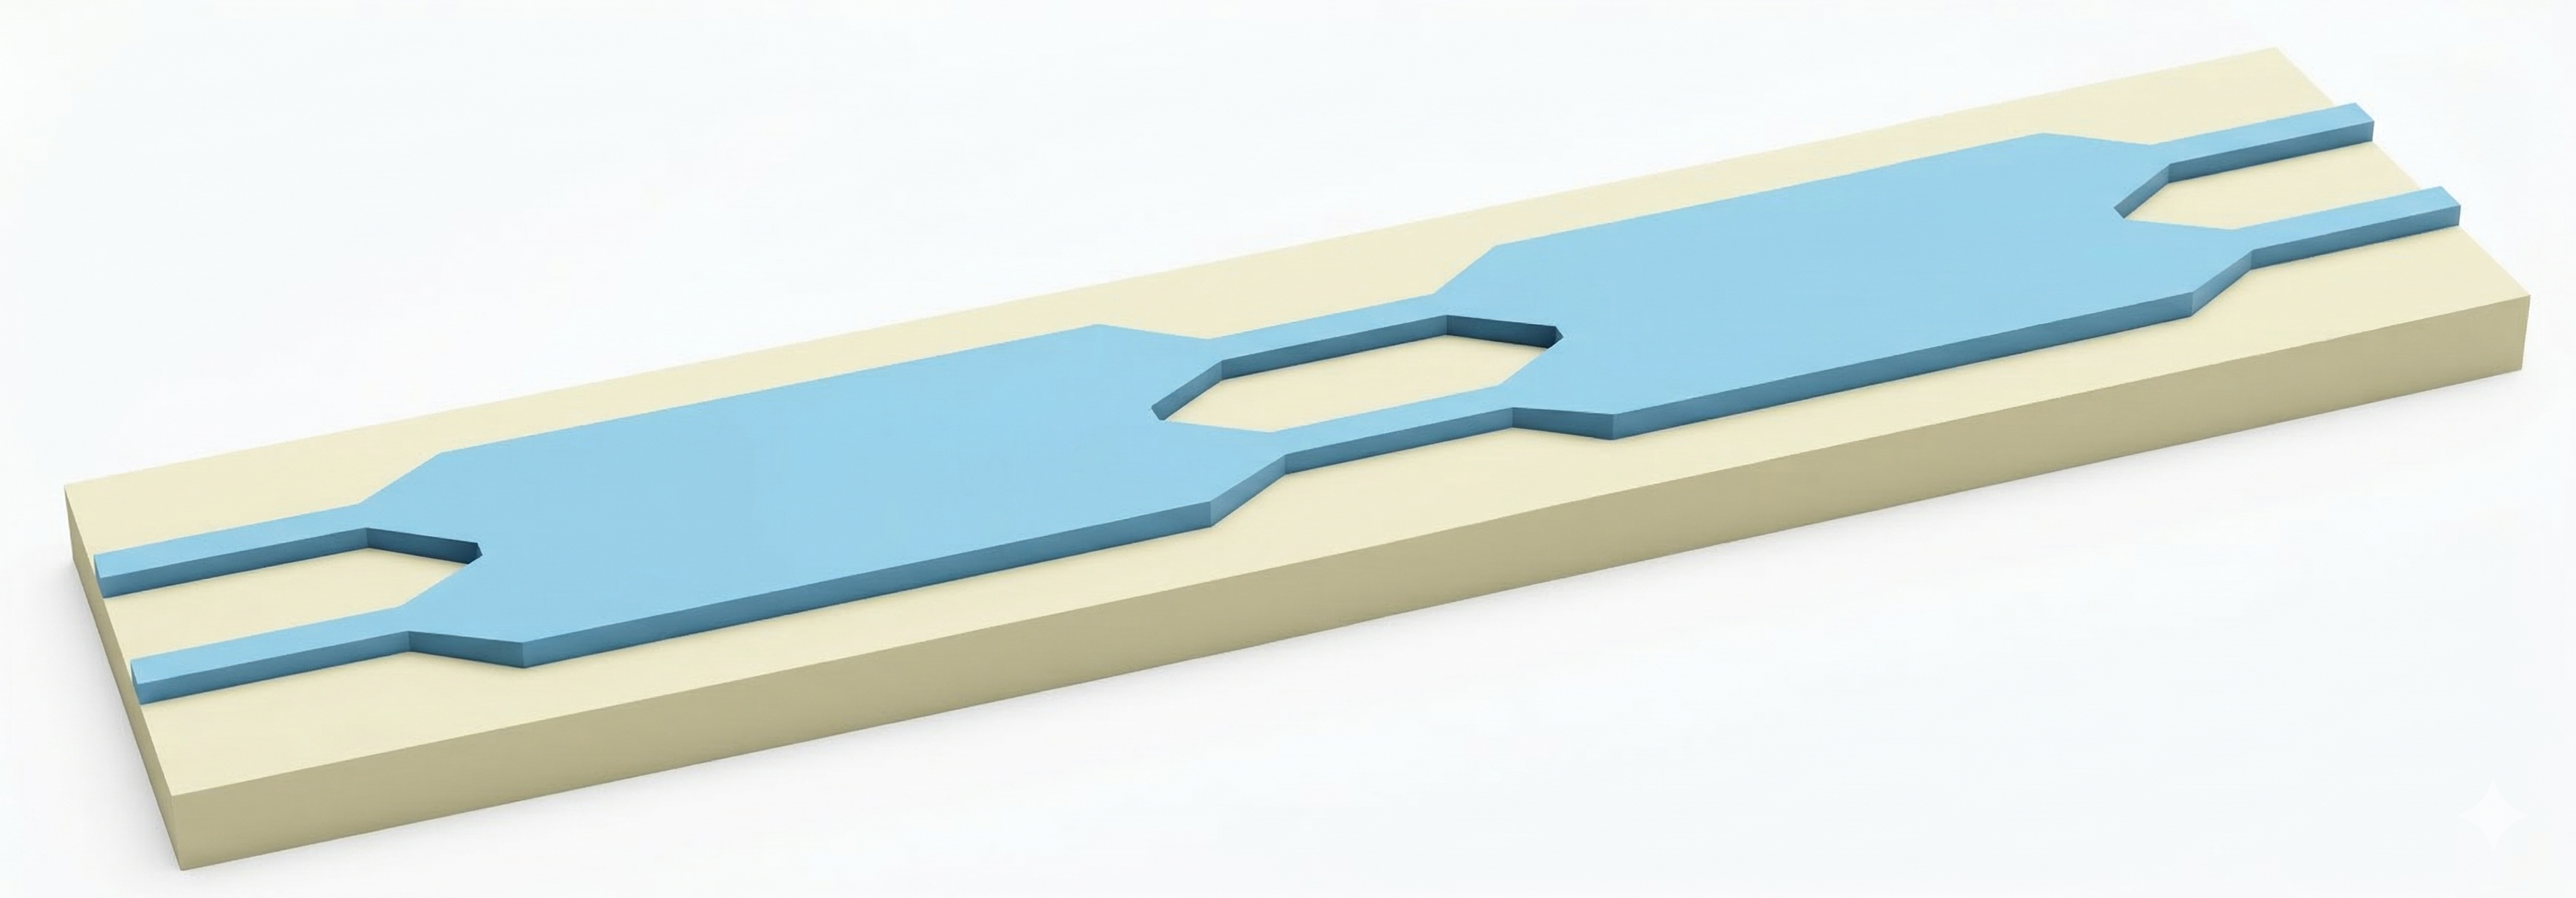
First, make the MMI array (2*2) layout using Photonforge.
import photonforge as pf
import tidy3d as td
import numpy as np
import matplotlib.pyplot as plt
from tidy3d import web

# Parameters
wg_width = 1.0
wg_height = 0.22
wg_length = 50.0
width_taper = 3.8
length_taper = 20.0
length_mmi = 362.0
width_mmi = 10.0
gap_mmi = 1.05
mmi_total = 2 * length_taper + length_mmi
route_length = 98
extend_length = 200.0

mmi2_move = 500.0

# Materials
wg_n = 3.48
medium_wg = td.Medium(permittivity=wg_n**2)
slab_bounds = (0, wg_height)


def mmi2x2(
    x0,
    y0,
    z0,
    width,
    width_taper,
    length_taper,
    length_mmi,
    width_mmi,
    gap_mmi,
    wg_thickness,
    medium,
    sidewall_angle=0.0,
):
    """
    MMI 2x2 power splitter built with Photonforge layout primitives.

    Port positions (absolute coordinates):
        o1: (x0 - length_mmi/2 - length_taper,  y0 - gap_mmi)
        o2: (x0 - length_mmi/2 - length_taper,  y0 + gap_mmi)
        o3: (x0 + length_mmi/2 + length_taper,  y0 + gap_mmi)
        o4: (x0 + length_mmi/2 + length_taper,  y0 - gap_mmi)
    """
    wg_slab = (z0 - wg_thickness / 2, z0 + wg_thickness / 2)

    x_left = -length_mmi / 2
    x_right = +length_mmi / 2
    y_offset = (width_taper + gap_mmi) / 2

    mmi_body = pf.Rectangle(size=(length_mmi, width_mmi))

    taper_in_top = pf.Path(origin=(x_left, +y_offset), width=width_taper)
    taper_in_top.segment((x_left - length_taper, +y_offset), width=(width, "linear"))

    taper_in_bot = pf.Path(origin=(x_left, -y_offset), width=width_taper)
    taper_in_bot.segment((x_left - length_taper, -y_offset), width=(width, "linear"))

    taper_out_top = pf.Path(origin=(x_right, +y_offset), width=width_taper)
    taper_out_top.segment((x_right + length_taper, +y_offset), width=(width, "linear"))

    taper_out_bot = pf.Path(origin=(x_right, -y_offset), width=width_taper)
    taper_out_bot.segment((x_right + length_taper, -y_offset), width=(width, "linear"))

    polygons = pf.boolean(
        [mmi_body, taper_in_top, taper_in_bot, taper_out_top, taper_out_bot],
        [],
        "+",
    )
    if len(polygons) != 1:
        raise ValueError(
            f"Boolean union produced {len(polygons)} polygons. "
            "Ensure gap_mmi < width_mmi/2 so tapers overlap the MMI body."
        )

    polygon = polygons[0]
    polygon.translate((x0, y0))

    return td.Structure(
        geometry=td.PolySlab(
            vertices=polygon.vertices,
            axis=2,
            slab_bounds=wg_slab,
            sidewall_angle=sidewall_angle,
            reference_plane="bottom",
        ),
        medium=medium,
    )


def make_straight(x_start, y_center, length):
    """Horizontal straight waveguide extending in +x from x_start."""
    path = pf.Path(origin=(x_start, y_center), width=wg_width)
    path.segment((x_start + length, y_center))
    return td.Structure(
        geometry=td.PolySlab(
            vertices=path.to_polygon().vertices,
            axis=2,
            slab_bounds=slab_bounds,
            reference_plane="bottom",
        ),
        medium=medium_wg,
    )


# Absolute x-positions
x_mmi1 = length_mmi / 2
x_mmi2 = mmi2_move + length_mmi / 2

x_route_start = x_mmi1 + length_mmi / 2 + length_taper
x_in_start = -(length_taper + extend_length)
x_out_start = x_mmi2 + length_mmi / 2 + length_taper

# Build structures
mmi1_struct = mmi2x2(
    x0=x_mmi1,
    y0=0,
    z0=wg_height / 2,
    width=wg_width,
    width_taper=width_taper,
    length_taper=length_taper,
    length_mmi=length_mmi,
    width_mmi=width_mmi,
    gap_mmi=gap_mmi,
    wg_thickness=wg_height,
    medium=medium_wg,
)

mmi2_struct = mmi2x2(
    x0=x_mmi2,
    y0=0,
    z0=wg_height / 2,
    width=wg_width,
    width_taper=width_taper,
    length_taper=length_taper,
    length_mmi=length_mmi,
    width_mmi=width_mmi,
    gap_mmi=gap_mmi,
    wg_thickness=wg_height,
    medium=medium_wg,
)

y_offset = (width_taper + gap_mmi) / 2

route_top = make_straight(x_route_start, +y_offset, route_length)
route_bot = make_straight(x_route_start, -y_offset, route_length)
in1_struct = make_straight(x_in_start, -y_offset, extend_length)
in2_struct = make_straight(x_in_start, +y_offset, extend_length)
out3_struct = make_straight(x_out_start, +y_offset, extend_length)
out4_struct = make_straight(x_out_start, -y_offset, extend_length)

structures = [
    mmi1_struct,
    mmi2_struct,
    route_top,
    route_bot,
    in1_struct,
    in2_struct,
    out3_struct,
    out4_struct,
]

print(
    f"mmi1 body:   x = [{x_mmi1 - length_mmi / 2:.0f}, {x_mmi1 + length_mmi / 2:.0f}]"
)
print(
    f"mmi2 body:   x = [{x_mmi2 - length_mmi / 2:.0f}, {x_mmi2 + length_mmi / 2:.0f}]"
)
print(
    f"route:       x = [{x_route_start:.0f}, {x_route_start + route_length:.0f}], length = {route_length:.0f} um"
)
print(f"domain:      x = [{x_in_start:.0f}, {x_out_start + extend_length:.0f}]")
mmi1 body:   x = [0, 362]
mmi2 body:   x = [500, 862]
route:       x = [382, 480], length = 98 um
domain:      x = [-220, 1082]
# ── Substrate medium ──────────────────────────────────────────────────────────
sub_n = 1.45
medium_sub = td.Medium(permittivity=sub_n**2)

# ── Simulation domain bounds ──────────────────────────────────────────────────
x_min = -(length_taper + wg_length)
x_max = mmi2_move + length_mmi + length_taper + wg_length
print(f"x_min={x_min:.0f}, x_max={x_max:.0f}, route_length={route_length:.0f}")

# y extent is set by the MMI body width (widest element in the structure)
y_min = -width_mmi / 2
y_max = +width_mmi / 2

port_offset = wg_length / 2
pml_spacing = 1.0

sim_size_eme = [
    (x_max - x_min) + 2 * port_offset,
    (y_max - y_min) + 2 * pml_spacing,
    wg_height + 2 * pml_spacing,
]
sim_center_eme = [
    (x_min + x_max) / 2,
    (y_min + y_max) / 2,
    wg_height / 2,
]

# ── EME Cell Boundaries ───────────────────────────────────────────────────────
num_modes = 20
n_taper = 10


def make_taper_boundaries(x_start, n):
    """Split range (x_start → x_start+length_taper) into n equal intervals."""
    return list(np.linspace(x_start, x_start + length_taper, n + 1)[1:])


x_wg_end = x_min + wg_length
x_mmi1_end = x_wg_end + length_taper + length_mmi
x_t2_end = x_mmi1_end + length_taper
x_rt_end = x_t2_end + route_length
x_mmi2_end = x_rt_end + length_taper + length_mmi

boundaries = [
    x_wg_end,
    *make_taper_boundaries(x_wg_end, n_taper),
    x_mmi1_end,
    *make_taper_boundaries(x_mmi1_end, n_taper),
    x_t2_end + route_length,
    *make_taper_boundaries(x_rt_end, n_taper),
    x_mmi2_end,
    *make_taper_boundaries(x_mmi2_end, n_taper),
]

mode_specs = (
    [td.EMEModeSpec(num_modes=4)]
    + [td.EMEModeSpec(num_modes=num_modes)] * n_taper
    + [td.EMEModeSpec(num_modes=num_modes)]
    + [td.EMEModeSpec(num_modes=num_modes)] * n_taper
    + [td.EMEModeSpec(num_modes=num_modes)]
    + [td.EMEModeSpec(num_modes=num_modes)] * n_taper
    + [td.EMEModeSpec(num_modes=num_modes)]
    + [td.EMEModeSpec(num_modes=num_modes)] * n_taper
    + [td.EMEModeSpec(num_modes=4)]
)

print(f"total cells: {len(mode_specs)}")
assert len(mode_specs) == len(boundaries) + 1

eme_grid_spec = td.EMEExplicitGrid(
    boundaries=boundaries,
    mode_specs=mode_specs,
)
x_min=-70, x_max=932, route_length=98
total cells: 45
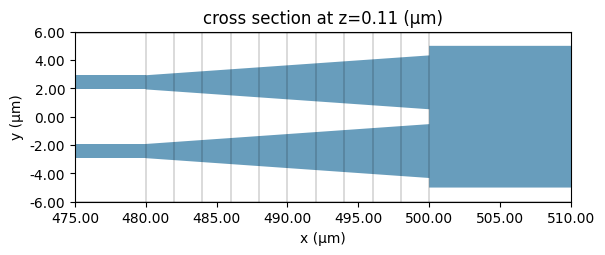
CHECK 1: Structure + Boundaries Visualization (no cost)
Verify vertical boundary lines align with taper/MMI interfaces.
eme_grid_spec_check = td.EMEExplicitGrid(boundaries=boundaries, mode_specs=mode_specs)

mode_mon_in = td.EMEModeSolverMonitor(
    name="modes_in",
    size=(0, td.inf, td.inf),
    center=[x_min + port_offset, sim_center_eme[1], wg_height / 2],
    num_modes=4,
    eme_cell_interval_space=1,  # 0 → 1
)
mode_mon_out = td.EMEModeSolverMonitor(
    name="modes_out",
    size=(0, td.inf, td.inf),
    center=[x_max - port_offset, sim_center_eme[1], wg_height / 2],
    num_modes=4,
    eme_cell_interval_space=1,  # 0 → 1
)

eme_sim_check = td.EMESimulation(
    size=sim_size_eme,
    center=sim_center_eme,
    structures=structures,
    medium=td.Medium(permittivity=sub_n**2),
    grid_spec=td.GridSpec.auto(min_steps_per_wvl=12, wavelength=1.55),
    eme_grid_spec=eme_grid_spec_check,
    monitors=[mode_mon_in, mode_mon_out],
    freqs=[td.C_0 / 1.55],
    axis=0,
    port_offsets=(port_offset, port_offset),
)

fig, axes = plt.subplots(2, 1, figsize=(17, 6))
eme_sim_check.plot(z=wg_height / 2, ax=axes[0], monitor_alpha=0)
axes[0].set_aspect("auto")
axes[0].set_title("Top View - Check vertical lines align with taper/MMI boundaries")
axes[0].set_xlabel("x (um)")
axes[0].set_ylabel("y (um)")
eme_sim_check.plot(y=0, ax=axes[1], monitor_alpha=0)
axes[1].set_aspect("auto")
axes[1].set_title("Cross Section (y=0)")
axes[1].set_xlabel("x (um)")
axes[1].set_ylabel("z (um)")


plt.tight_layout()
plt.show()

fig, ax = plt.subplots()
eme_sim_check.plot(z=wg_height / 2, monitor_alpha=0, ax=ax)
ax.set_xlim(475, 510)
ax.set_ylim(-6, 6)
plt.show()
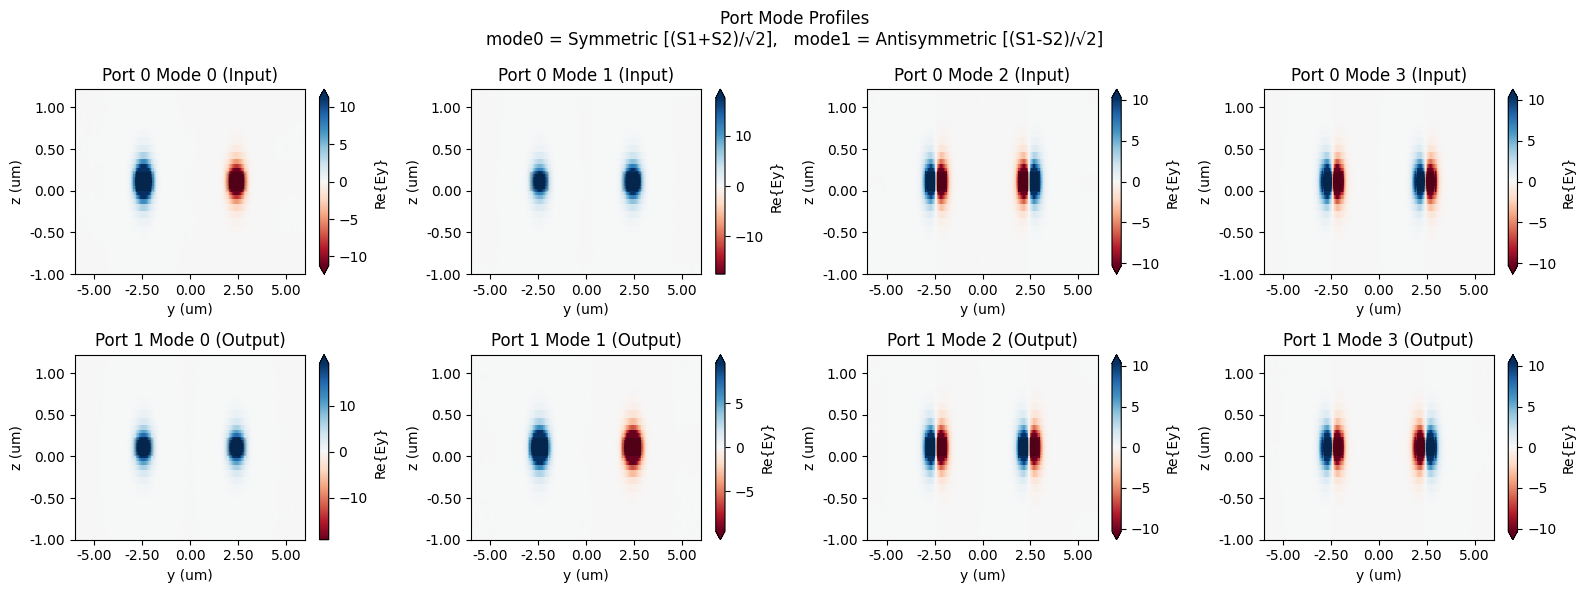
CHECK 2: Port Mode Profiles (small cost)
Verify mode basis at input/output ports:
- mode0 = Symmetric mode = (S1 + S2) / √2
- mode1 = Antisymmetric mode = (S1 - S2) / √2
# ── Run mode check simulation ──────────────────────────────────
data_check = web.run(eme_sim_check, task_name="MMI_mode_check")

# Print available EME cell indices for input and output monitors
print(f"modes_in  cell indices: {data_check['modes_in'].Ey.eme_cell_index.values}")
print(f"modes_out cell indices: {data_check['modes_out'].Ey.eme_cell_index.values}")

# Select valid EME cell indices (typically the first available index)
valid_idx_in = int(data_check["modes_in"].Ey.eme_cell_index.values[0])
valid_idx_out = int(data_check["modes_out"].Ey.eme_cell_index.values[0])

print(f"Using -> modes_in: {valid_idx_in},  modes_out: {valid_idx_out}")

# ── Plot mode profiles at input and output ports ───────────────
fig, axes = plt.subplots(2, 4, figsize=(16, 6))

# Input port modes
for i in range(4):
    data_check.plot_field(
        "modes_in",
        "Ey",
        eme_cell_index=valid_idx_in,
        mode_index=i,
        ax=axes[0][i],
    )
    axes[0][i].set_title(f"Port 0 Mode {i} (Input)")
    axes[0][i].set_aspect("auto")
    axes[0][i].set_xlabel("y (um)")
    axes[0][i].set_ylabel("z (um)")

# Output port modes
for i in range(4):
    data_check.plot_field(
        "modes_out",
        "Ey",
        eme_cell_index=valid_idx_out,
        mode_index=i,
        ax=axes[1][i],
    )
    axes[1][i].set_title(f"Port 1 Mode {i} (Output)")
    axes[1][i].set_aspect("auto")
    axes[1][i].set_xlabel("y (um)")
    axes[1][i].set_ylabel("z (um)")

plt.suptitle(
    "Port Mode Profiles\n"
    "mode0 = Symmetric [(S1+S2)/√2],   mode1 = Antisymmetric [(S1-S2)/√2]"
)

plt.tight_layout()
plt.show()
16:29:50 -03 Loading simulation from local cache. View cached task using web UI
             at
             'https://tidy3d.simulation.cloud/workbench?taskId=eme-a9cea290-87bc
             -4985-9784-cb5079b0678e'.
modes_in  cell indices: [0]
modes_out cell indices: [44]
Using -> modes_in: 0,  modes_out: 44
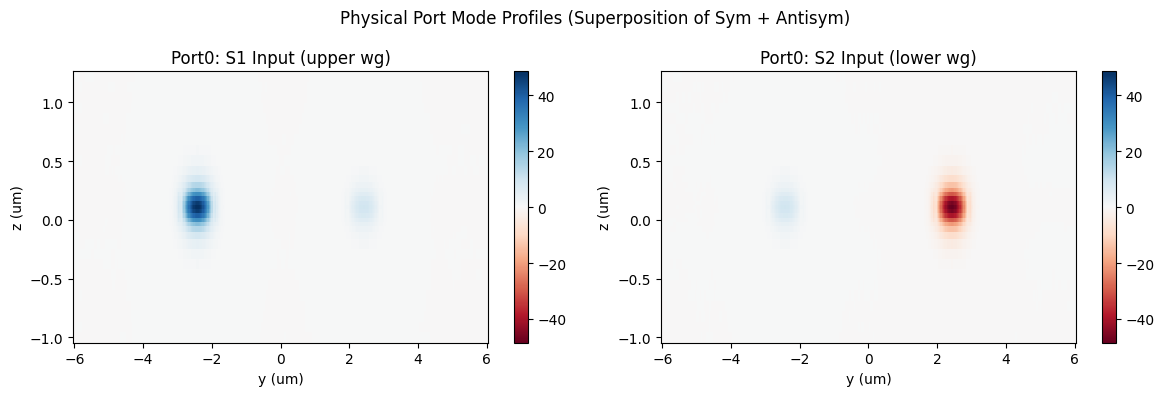
field_sym = data_check["modes_in"].Ey.isel(eme_cell_index=0, mode_index=0, f=0)
field_asym = data_check["modes_in"].Ey.isel(eme_cell_index=0, mode_index=1, f=0)

# ── Superposition: mode basis → physical port ─────────────────
# S1 (upper wg) = (sym + antisym) / sqrt(2)
# S2 (lower wg) = (sym - antisym) / sqrt(2)
field_S1 = (field_sym + field_asym) / np.sqrt(2)
field_S2 = (field_sym - field_asym) / np.sqrt(2)

fig, axes = plt.subplots(1, 2, figsize=(12, 4))

field_S1.real.plot(ax=axes[0], cmap="RdBu", x="y", y="z")
axes[0].set_aspect("auto")
axes[0].set_title("Port0: S1 Input (upper wg)")
axes[0].set_xlabel("y (um)")
axes[0].set_ylabel("z (um)")

field_S2.real.plot(ax=axes[1], cmap="RdBu", x="y", y="z")
axes[1].set_aspect("auto")
axes[1].set_title("Port0: S2 Input (lower wg)")
axes[1].set_xlabel("y (um)")
axes[1].set_ylabel("z (um)")

plt.suptitle("Physical Port Mode Profiles (Superposition of Sym + Antisym)")
plt.tight_layout()
plt.show()
Main Simulation
Run after CHECK 1 & 2 are verified.
# ── Resolution 파라미터 ──────────────────────────────────────
num_modes = 20
n_taper = 10
n_mmi = 1
n_route = 1

# ── EME Grid Spec ────────────────────────────────────────────
mode_specs = (
    [td.EMEModeSpec(num_modes=4)]  # input wg
    + [td.EMEModeSpec(num_modes=num_modes)] * n_taper  # taper1
    + [td.EMEModeSpec(num_modes=num_modes)] * n_mmi  # MMI1
    + [td.EMEModeSpec(num_modes=num_modes)] * n_taper  # taper2
    + [td.EMEModeSpec(num_modes=num_modes)] * n_route  # route
    + [td.EMEModeSpec(num_modes=num_modes)] * n_taper  # taper3
    + [td.EMEModeSpec(num_modes=num_modes)] * n_mmi  # MMI2
    + [td.EMEModeSpec(num_modes=num_modes)] * n_taper  # taper4
    + [td.EMEModeSpec(num_modes=4)]  # output wg
)

assert len(mode_specs) == len(boundaries) + 1, (
    f"mode_specs({len(mode_specs)}) != boundaries({len(boundaries)}) + 1"
)

eme_grid_spec = td.EMEExplicitGrid(
    boundaries=boundaries,
    mode_specs=mode_specs,
)

# ── Monitors ─────────────────────────────────────────────────
eme_field_mon = td.EMEFieldMonitor(
    name="field",
    size=(td.inf, td.inf, 0),
    center=[sim_center_eme[0], sim_center_eme[1], wg_height / 2],
)

# ── EME Simulation ───────────────────────────────────────────
eme_sim = td.EMESimulation(
    size=sim_size_eme,
    center=sim_center_eme,
    structures=structures,
    medium=td.Medium(permittivity=sub_n**2),
    grid_spec=td.GridSpec.auto(min_steps_per_wvl=12, wavelength=1.55),
    eme_grid_spec=eme_grid_spec,
    monitors=[eme_field_mon],
    freqs=[td.C_0 / 1.55],
    axis=0,
    port_offsets=(port_offset, port_offset),
)

print(f"total cells: {len(mode_specs)}")  # n_taper=10 → 47
eme_sim_data = web.run(eme_sim, task_name="MMI_array_EME")
total cells: 45
16:30:12 -03 Loading simulation from local cache. View cached task using web UI
             at
             'https://tidy3d.simulation.cloud/workbench?taskId=eme-349c27f0-30bc
             -4da5-be8d-996d414c1b7e'.
S-parameter Extraction
Convert EME mode basis → physical port basis:
EME mode basis                Physical port
──────────────────────────────────────────────
mode0 (symmetric)   = (S1+S2)/√2  or  (S3+S4)/√2
mode1 (antisymmetric) = (S1-S2)/√2  or  (S3-S4)/√2

Inverse:
  S1 = (mode0 + mode1) / √2
  S2 = (mode0 - mode1) / √2
  S3 = (mode0 + mode1) / √2
  S4 = (mode0 - mode1) / √2
smatrix = eme_sim_data.smatrix

# EME mode basis complex amplitudes
S21_00 = smatrix.S21.isel(mode_index_in=0, mode_index_out=0, f=0)  # sym_in  -> sym_out
S21_01 = smatrix.S21.isel(mode_index_in=0, mode_index_out=1, f=0)  # sym_in  -> asym_out
S21_10 = smatrix.S21.isel(mode_index_in=1, mode_index_out=0, f=0)  # asym_in -> sym_out
S21_11 = smatrix.S21.isel(mode_index_in=1, mode_index_out=1, f=0)  # asym_in -> asym_out

S11_00 = smatrix.S11.isel(mode_index_in=0, mode_index_out=0, f=0)
S11_01 = smatrix.S11.isel(mode_index_in=0, mode_index_out=1, f=0)
S11_10 = smatrix.S11.isel(mode_index_in=1, mode_index_out=0, f=0)
S11_11 = smatrix.S11.isel(mode_index_in=1, mode_index_out=1, f=0)

# ── Mode basis → Physical port basis ──────────────────────────
# Transmission S1 input
E_S1_to_S3 = (S21_00 + S21_01 + S21_10 + S21_11) / 2
E_S1_to_S4 = (S21_00 - S21_01 + S21_10 - S21_11) / 2
# Transmission S2 input
E_S2_to_S3 = (S21_00 + S21_01 - S21_10 - S21_11) / 2
E_S2_to_S4 = (S21_00 - S21_01 - S21_10 + S21_11) / 2
# Reflection S1 input
E_S1_to_S1 = (S11_00 + S11_01 + S11_10 + S11_11) / 2
E_S1_to_S2 = (S11_00 - S11_01 + S11_10 - S11_11) / 2
# Reflection S2 input
E_S2_to_S1 = (S11_00 + S11_01 - S11_10 - S11_11) / 2
E_S2_to_S2 = (S11_00 - S11_01 - S11_10 + S11_11) / 2

S13 = float(E_S1_to_S3.abs**2)
S14 = float(E_S1_to_S4.abs**2)
S23 = float(E_S2_to_S3.abs**2)
S24 = float(E_S2_to_S4.abs**2)
S11 = float(E_S1_to_S1.abs**2)
S12 = float(E_S1_to_S2.abs**2)
S21 = float(E_S2_to_S1.abs**2)
S22 = float(E_S2_to_S2.abs**2)

print("── S1 Input ───────────────────────────────────")
print(f"S11 (S1->S1 reflection): {S11:.4f}  ({10 * np.log10(S11 + 1e-12):.2f} dB)")
print(f"S12 (S1->S2 reflection): {S12:.4f}  ({10 * np.log10(S12 + 1e-12):.2f} dB)")
print(f"S13 (S1->S3):            {S13:.4f}  ({10 * np.log10(S13 + 1e-12):.2f} dB)")
print(f"S14 (S1->S4):            {S14:.4f}  ({10 * np.log10(S14 + 1e-12):.2f} dB)")
print(
    f"Total transmission:      {S13 + S14:.4f}  ({10 * np.log10(S13 + S14 + 1e-12):.2f} dB)"
)
print()
print("── S2 Input ───────────────────────────────────")
print(f"S21 (S2->S1 reflection): {S21:.4f}  ({10 * np.log10(S21 + 1e-12):.2f} dB)")
print(f"S22 (S2->S2 reflection): {S22:.4f}  ({10 * np.log10(S22 + 1e-12):.2f} dB)")
print(f"S23 (S2->S3):            {S23:.4f}  ({10 * np.log10(S23 + 1e-12):.2f} dB)")
print(f"S24 (S2->S4):            {S24:.4f}  ({10 * np.log10(S24 + 1e-12):.2f} dB)")
print(
    f"Total transmission:      {S23 + S24:.4f}  ({10 * np.log10(S23 + S24 + 1e-12):.2f} dB)"
)
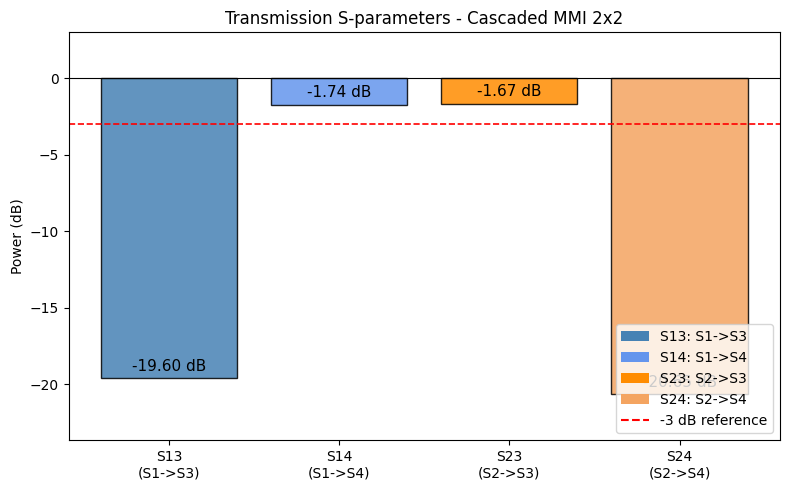
── S1 Input ───────────────────────────────────
S11 (S1->S1 reflection): 0.0005  (-33.33 dB)
S12 (S1->S2 reflection): 0.0004  (-33.83 dB)
S13 (S1->S3):            0.0110  (-19.60 dB)
S14 (S1->S4):            0.6700  (-1.74 dB)
Total transmission:      0.6810  (-1.67 dB)

── S2 Input ───────────────────────────────────
S21 (S2->S1 reflection): 0.0000  (-49.24 dB)
S22 (S2->S2 reflection): 0.0001  (-38.82 dB)
S23 (S2->S3):            0.6802  (-1.67 dB)
S24 (S2->S4):            0.0086  (-20.65 dB)
Total transmission:      0.6888  (-1.62 dB)
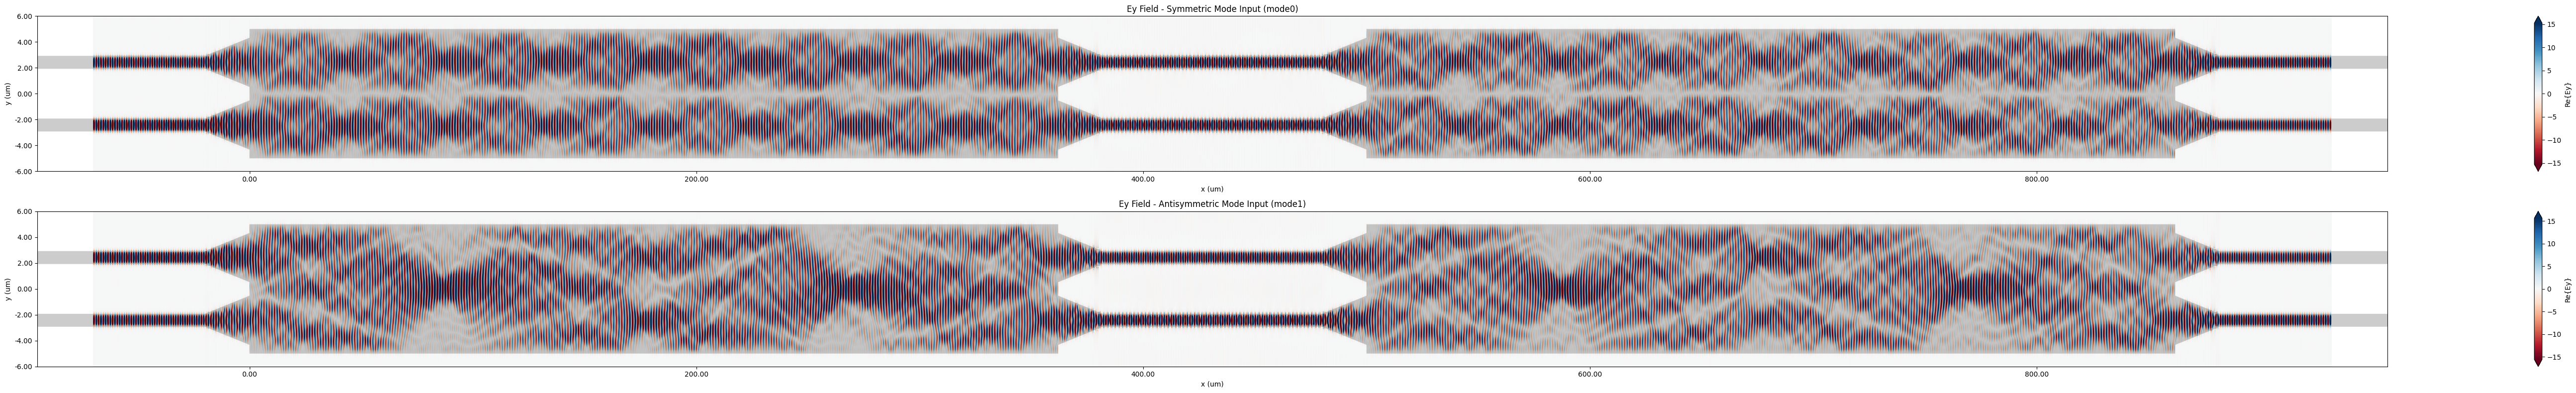
Field Visualization
fig, axes = plt.subplots(2, 1, figsize=(60, 8))
eme_sim_data.plot_field("field", "Ey", eme_port_index=0, mode_index=0, ax=axes[0])
axes[0].set_aspect("auto")
axes[0].set_title("Ey Field - Symmetric Mode Input (mode0)")
axes[0].set_xlabel("x (um)")
axes[0].set_ylabel("y (um)")
eme_sim_data.plot_field("field", "Ey", eme_port_index=0, mode_index=1, ax=axes[1])
axes[1].set_aspect("auto")
axes[1].set_title("Ey Field - Antisymmetric Mode Input (mode1)")
axes[1].set_xlabel("x (um)")
axes[1].set_ylabel("y (um)")
plt.tight_layout()
plt.show()
from matplotlib.patches import Patch

labels = ["S13\n(S1->S3)", "S14\n(S1->S4)", "S23\n(S2->S3)", "S24\n(S2->S4)"]
values_dB = [
    10 * np.log10(S13 + 1e-12),
    10 * np.log10(S14 + 1e-12),
    10 * np.log10(S23 + 1e-12),
    10 * np.log10(S24 + 1e-12),
]
colors = ["steelblue", "cornflowerblue", "darkorange", "sandybrown"]

fig, ax = plt.subplots(figsize=(8, 5))
bars = ax.bar(labels, values_dB, color=colors, edgecolor="black", alpha=0.85)
ax.axhline(y=-3, color="red", linestyle="--", linewidth=1.2, label="-3 dB reference")
ax.axhline(y=0, color="black", linestyle="-", linewidth=0.8)

for bar, val in zip(bars, values_dB):
    ax.text(
        bar.get_x() + bar.get_width() / 2,
        bar.get_height() + 0.3,
        f"{val:.2f} dB",
        ha="center",
        va="bottom",
        fontsize=11,
    )

ax.set_ylabel("Power (dB)")
ax.set_title("Transmission S-parameters - Cascaded MMI 2x2")
ax.set_ylim([min(values_dB) - 3, 3])

legend_elements = [
    Patch(facecolor="steelblue", label="S13: S1->S3"),
    Patch(facecolor="cornflowerblue", label="S14: S1->S4"),
    Patch(facecolor="darkorange", label="S23: S2->S3"),
    Patch(facecolor="sandybrown", label="S24: S2->S4"),
    plt.Line2D([0], [0], color="red", linestyle="--", label="-3 dB reference"),
]
ax.legend(handles=legend_elements, loc="lower right")
plt.tight_layout()
plt.show()