





# import packages and authenticate (if needed)
import matplotlib.pylab as plt
import numpy as np
import tidy3d as td
import tidy3d.web as web

# web.configure("YOUR API KEY GOES HERE")
TIDY3D
LEARNING CENTER
Tidy3D Python

Complete this course to
earn 50 FlexCredits
Credits are added to your account when all course items are checked in green.
Quickstart
This is a minimal Tidy3D script showing the FDTD simulation of a dielectric cube in the presence of a point dipole.
Before running this notebook, make sure to have:
First, we use the convenience class FreqRange to define the basic frequency-related parameters of the simulation.
lda0 = 0.75  # wavelength of interest (length scales are micrometers in Tidy3D)
freq0 = td.C_0 / lda0  # frequency of interest
fwidth = freq0 / 10.0  # desired freq. bandwidth

freq_range = td.FreqRange(freq0=freq0, fwidth=fwidth)  # set frequency range
Create a Structure from a Geometry like this rectangular prism Box and assign a Medium to represent its optical properties.
square = td.Structure(
    geometry=td.Box(center=(0, 0, 0), size=(1.5, 1.5, 1.5)), medium=td.Medium(permittivity=2.0)
)
Create a Source. In this case, it is a PointDipole, which is a uniform current source with a zero size.
# create source
source = td.PointDipole(
    center=(-1.5, 0, 0),  # position of the dipole
    source_time=freq_range.to_gaussian_pulse(),  # time profile of the source
    polarization="Ey",  # polarization of the dipole
)
Create a Monitor like a FieldMonitor to record electromagnetic fields in the frequency domain at freq0.
# create monitor
monitor = td.FieldMonitor(
    center=(0, 0, 0),  # center of the monitor
    size=(td.inf, td.inf, 0),  # size of the monitor
    freqs=freq_range.freqs(num_points=1),  # frequency points to record the fields at
    name="fields",
)
All these components are used to create a Tidy3D Simulation:
sim = td.Simulation(
    size=(4, 3, 3),  # simulation domain size
    grid_spec=td.GridSpec.auto(
        min_steps_per_wvl=25
    ),  # automatic nonuniform FDTD grid with 25 grids per wavelength in the material
    structures=[square],
    sources=[source],
    monitors=[monitor],
    run_time=3e-13,  # physical simulation time in second
)
# visualize in 3D
sim.plot_3d()print(
f"simulation grid is shaped {sim.grid.num_cells} for {int(np.prod(sim.grid.num_cells) / 1e6)} million cells."
)simulation grid is shaped [179, 147, 147] for 3 million cells.The python web API is used to run your simulation quickly in the cloud. The output data is stored in a SimulationData container.
# run simulation
data = td.web.run(sim, task_name="quickstart", path="data/data.hdf5", verbose=True)
07:23:40 UTC Created task 'quickstart' with resource_id 'fdve-fe74f8ae-8cde-476c-8db1-ca4e7c7c7a6a' and task_type 'FDTD'.
             View task using web UI at
             'https://tidy3d.simulation.cloud/workbench?taskId=fdve-fe74f8ae-8cd
             e-476c-8db1-ca4e7c7c7a6a'.
Task folder: 'default'.
07:23:42 UTC Estimated FlexCredit cost: 0.025. This assumes the FDTD solver runs
             for the full simulation time; if early shutoff is reached, the
             billed cost can be lower. Use 'web.real_cost(task_id)' to get the
             billed FlexCredit cost after a simulation run.
status = queued
             To cancel the simulation, use 'web.abort(task_id)' or
             'web.delete(task_id)' or abort/delete the task in the web UI.
             Terminating the Python script will not stop the job running on the
             cloud.
07:23:56 UTC starting up solver
running solver
07:23:58 UTC early shutoff detected at 31%, exiting.
status = postprocess
07:24:01 UTC status = success
07:24:03 UTC View simulation result at
             'https://tidy3d.simulation.cloud/workbench?taskId=fdve-fe74f8ae-8cd
             e-476c-8db1-ca4e7c7c7a6a'.
07:24:04 UTC Loading results from data/data.hdf5
# see the log
print(data.log)
[07:23:51] INFO: Auto meshing using wavelength 0.7519 defined from sources.
INFO: Auto meshing using wavelength 0.7519 defined from sources.
INFO: Auto meshing using wavelength 0.7519 defined from sources.
[07:23:52] USER: Simulation domain Nx, Ny, Nz: [179, 147, 147]
USER: Applied symmetries: (0, 0, 0)
USER: Number of computational grid points: 4.0184e+06.
USER: Subpixel averaging method: SubpixelSpec()
USER: Number of time steps: 7.5090e+03
USER: Automatic shutoff factor: 1.00e-05
USER: Time step (s): 3.9959e-17
USER:
USER: Compute source modes time (s): 0.2004
USER: Rest of setup time (s): 0.2214
[07:23:53] USER: Compute monitor modes time (s): 0.0002
[07:23:56] USER: Solver time (s): 2.6350
USER: Time-stepping speed (cells/s): 4.87e+09
USER: Loading data for monitor fields
USER: Post-processing time (s): 0.2674
====== SOLVER LOG ======
Processing grid and structures...
Building FDTD update coefficients...
Solver setup time (s): 0.6459
Running solver for 7509 time steps...
- Time step 300 / time 1.20e-14s ( 4 % done), field decay: 1.00e+00
- Time step 600 / time 2.40e-14s ( 8 % done), field decay: 1.00e+00
- Time step 901 / time 3.60e-14s ( 12 % done), field decay: 1.00e+00
- Time step 1201 / time 4.80e-14s ( 16 % done), field decay: 3.09e-01
- Time step 1501 / time 6.00e-14s ( 20 % done), field decay: 3.09e-01
- Time step 1802 / time 7.20e-14s ( 24 % done), field decay: 1.73e-03
- Time step 2102 / time 8.40e-14s ( 28 % done), field decay: 1.25e-05
- Time step 2400 / time 9.59e-14s ( 31 % done), field decay: 1.81e-07
Field decay smaller than shutoff factor, exiting solver.
Time-stepping time (s): 1.9824
Data write time (s): 0.0043
This monitor data can be easily plotted through available plot methods. You can also save, modify, and custom plot the raw FieldData and more.
# plot the field data stored in the monitor
ax = data.plot_field("fields", "Ey", z=0)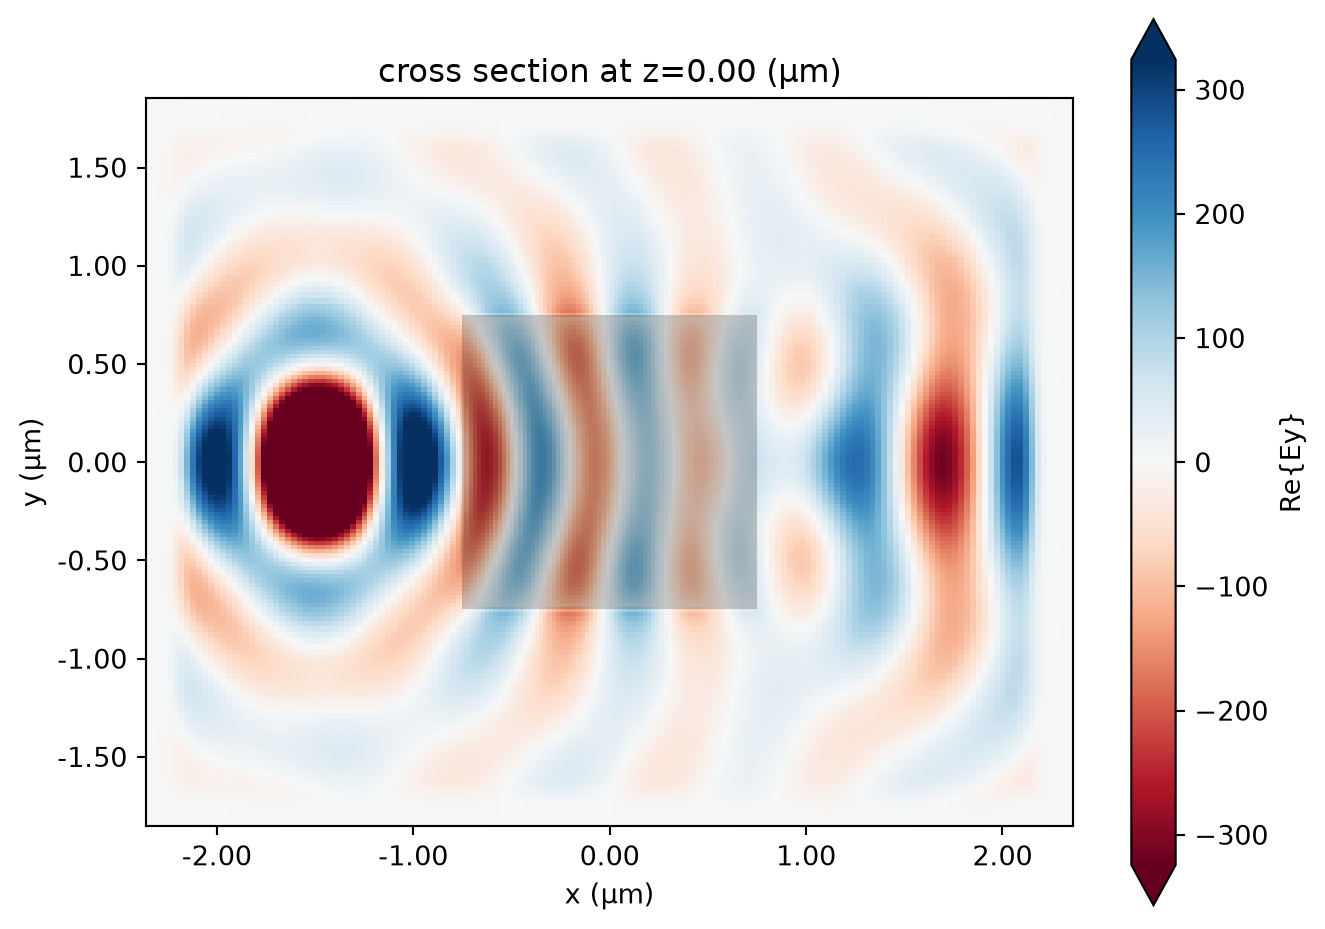
See all our examples to help you with your own designs!


 TERMS & CONDITIONS


 How the process works:
 Try this real URL to see an example: