Aerodynamic Stall in Aviation - Angle of Attack (AoA)
Pilots of fixed-wing aircraft receive training about how to avoid and, if needed, recover from aerodynamic stalls. A stall condition can result in a pilot’s inability to effectively control the aircraft, loss of control (LOC), and is a major safety concern[1]. Training involves intentionally maneuvering the aircraft to induce a stall under a variety of power settings and configurations.
The term “aerodynamic stall” or simply “stall” is used to describe a situation in which the airflow around the aircraft wings is no longer smoothly following the wing shape as intended. Specifically, flow above the wing separates away from the wing surface, causing relatively large regions of recirculating and turbulent flow. Separation, and thus stall, occurs as the angle of flow approaching the wing, angle-of-attack (AoA), increases beyond some design-specific threshold. A wing, or airfoil, will provide more lift as AoA is increased until the critical AoA is exceeded and stall occurs.
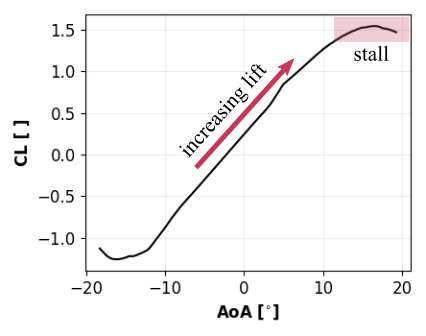
Figure 1 Coefficient of lift (CL) vs angle-of-attack (AoA) for a NACA 2412 airfoil.
While stall is directly related to the relative angle of the wing to the approaching flow, pilots are often provided with guidance regarding stall speeds of the aircraft instead. This is due in part to avoid reliance on sensors that measure AoA and also to relate to common flight operations, such as targeting an approach speed. Angle-of-attack is largely dependent on airspeed, however, so stall conditions can be avoided in practice by maintaining speeds above the aircraft’s stall speed. This AoA-airspeed dependence is the result of how much lift the wing is able to generate. The wing’s airfoil design determines the coefficient of lift, CL, vs AoA relationship as seen in Figure 1. This coefficient is nondimensional and is used to calculate the physical lift force. The physical lift force generated by the wing is proportional to the squared airspeed, U2, multiplied by CL.
What this means is that to maintain level flight (ie, lift equal to weight) at low airspeeds, the CL must be increased by increasing AoA. The slower the airspeed, the higher the AoA required and consequently, the wing moves closer to stall conditions.
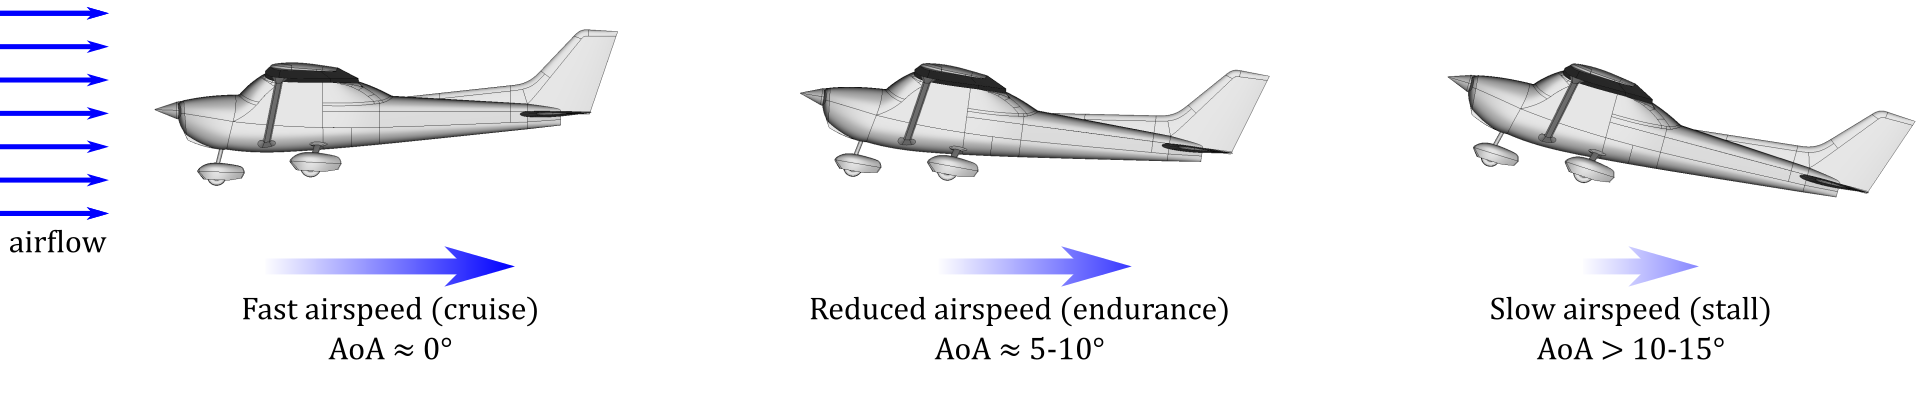
Figure 2 Angle-of-attack (AoA) relative to airspeed.
GENERAL CHARACTERISTICS
To investigate the details of aerodynamic stall, we use the Flow360 solver to create computational fluid dynamics (CFD) simulations of the flowfield around a Cessna 172 Skyhawk. Simulations consist of a simple AoA sweep, with smaller increments of AoA near stall.
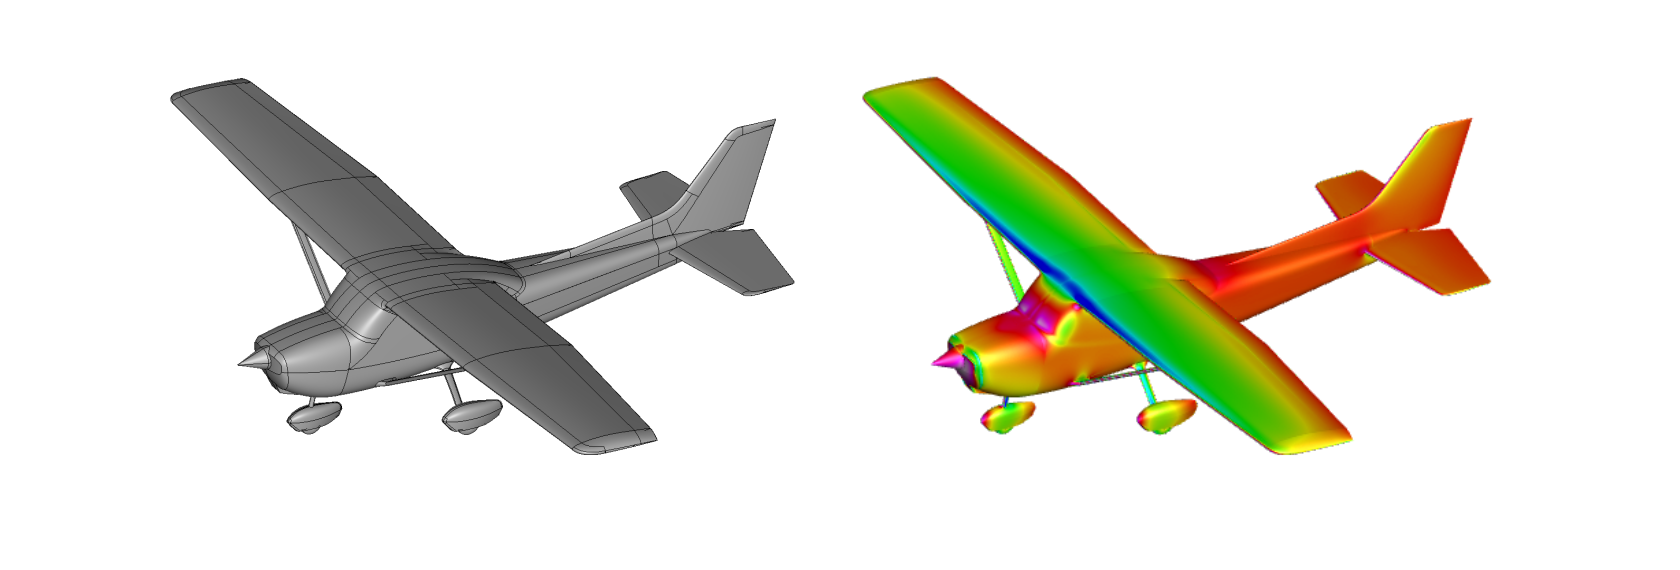
Figure 3 Cessna 172 Skyhawk geometry and pressure contours from CFD.
Creating a slice through the flowfield allows for a simplified view of the stall phenomenon. The following figures are slices at constant y (spanwise direction) and positioned at the mid-span of the port wing. Flow is from left to right. Pressure contours and streamtraces are displayed.
Results at AoA = 0° are consistent with classical examples of flow around an airfoil (see Figure 4). Streamtraces closely follow the airfoil shape everywhere. There is a strong pressure rise at the leading edge (LE) where incoming flow stagnates. Above the airfoil, a large region of low pressure is found along nearly the entire chord length.
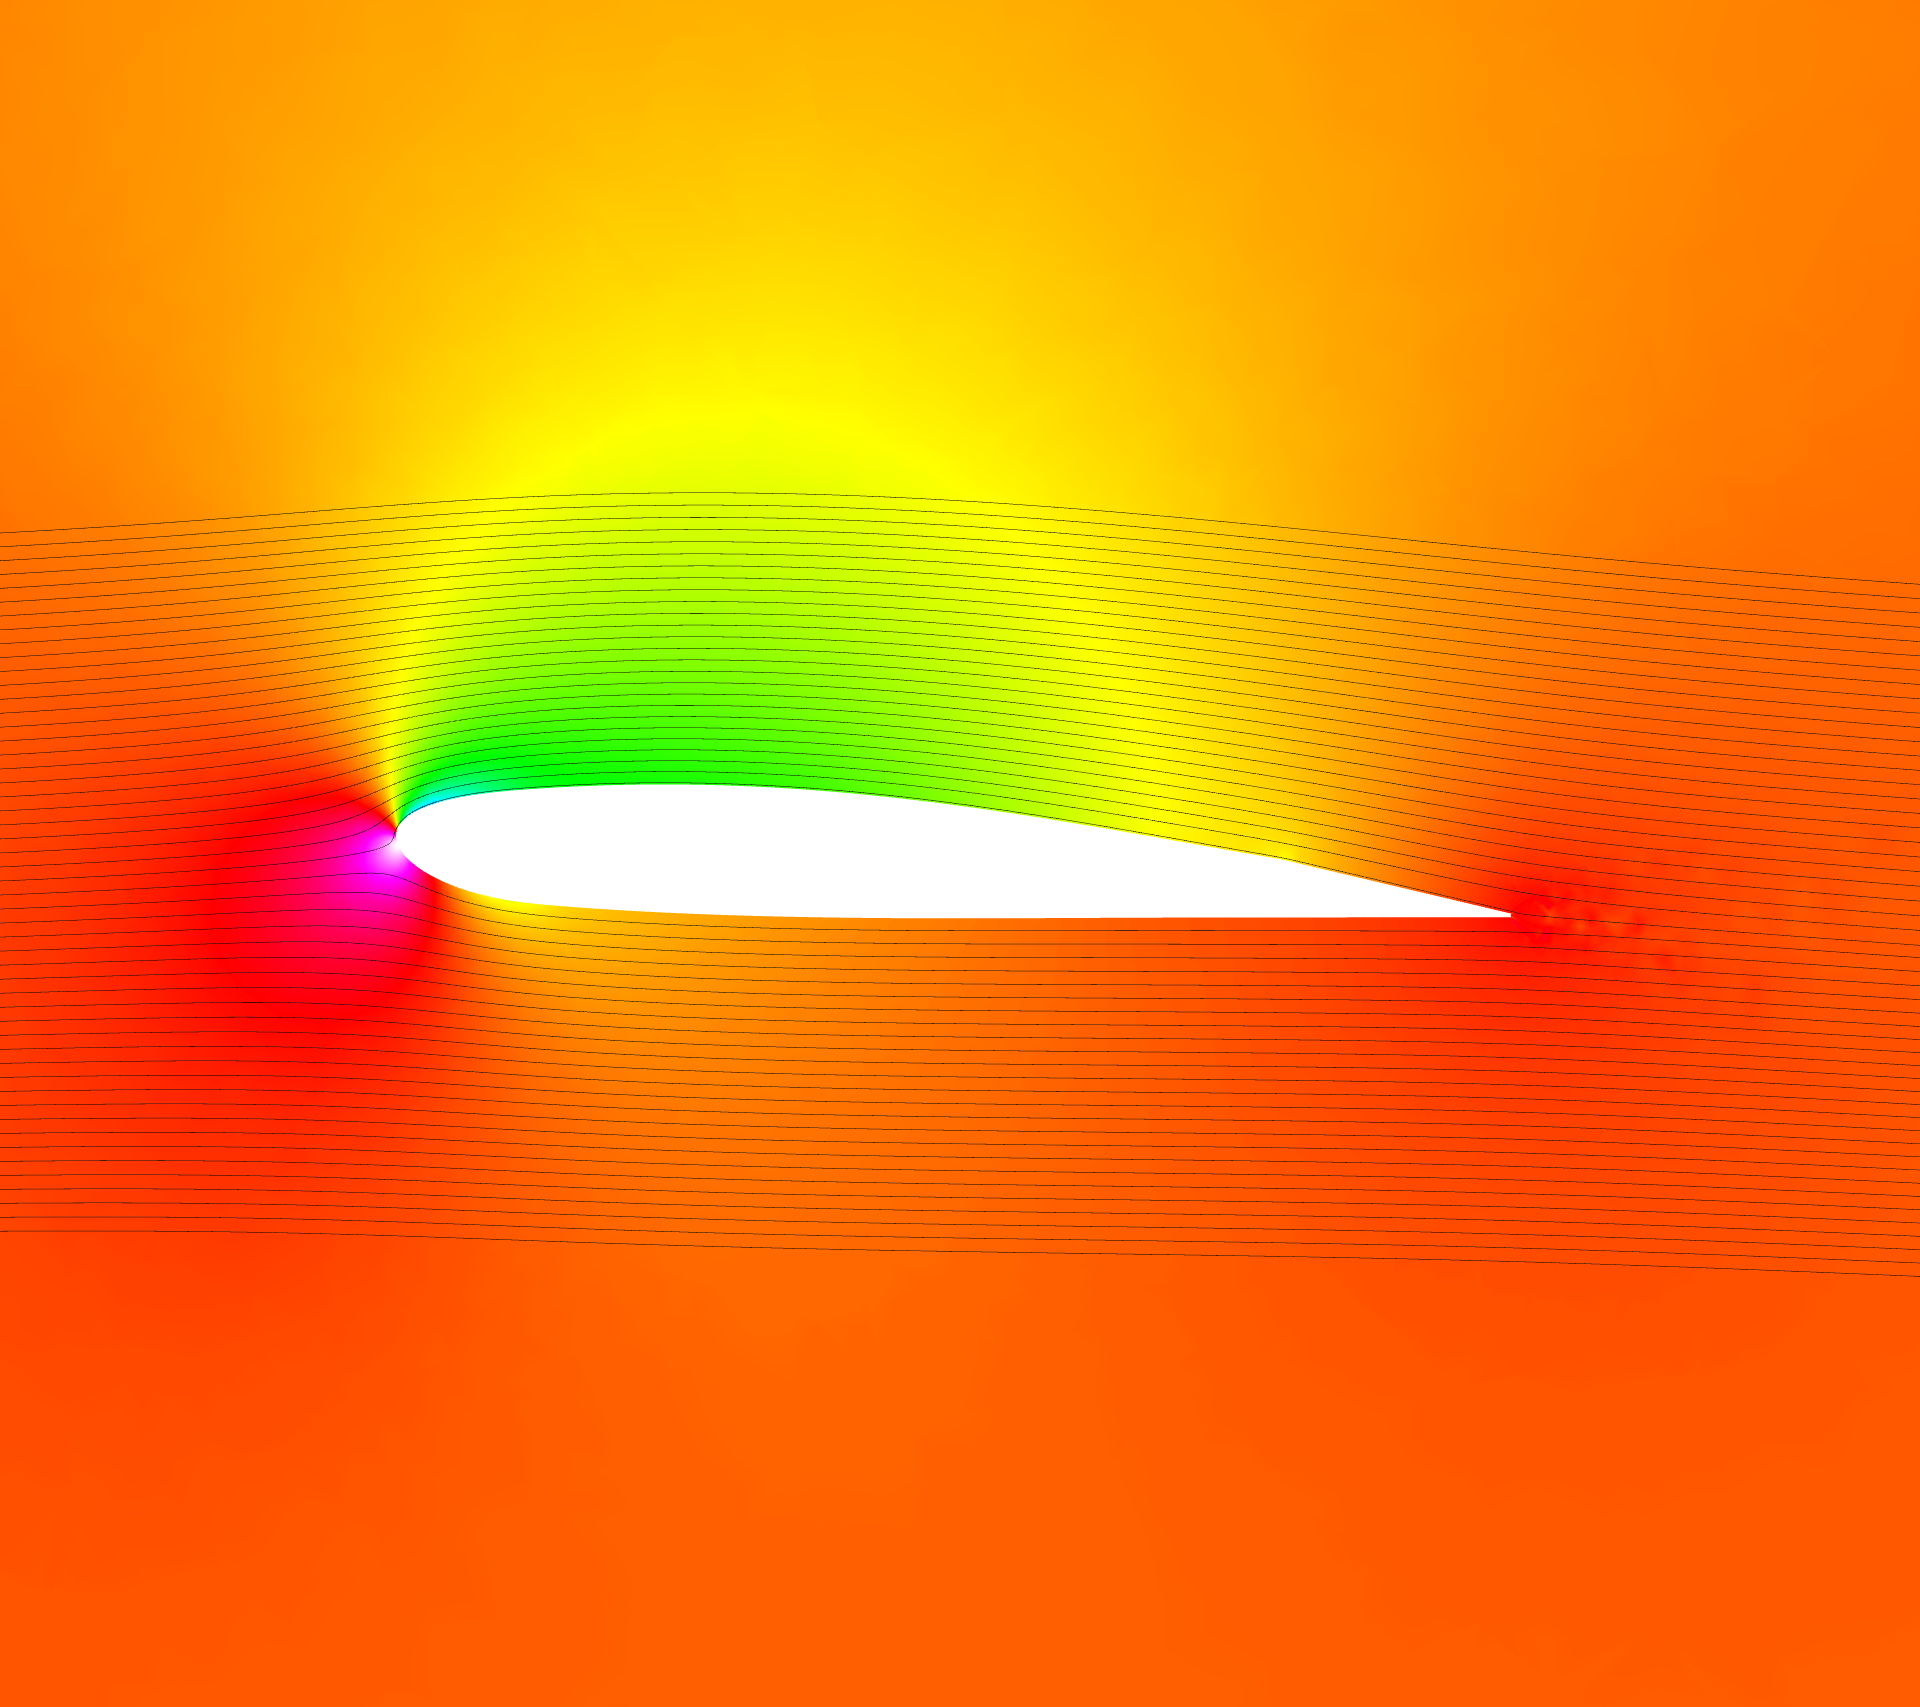
Figure 4 Slice through wing mid-span at AoA = 0°. Pressure contours and streamtraces displayed.
As AoA is increased, however, the flowfield changes significantly as stall conditions are approached (see Figure 5). At 10° AoA the upper low pressure region has increased in size and magnitude, which corresponds to increasing lift seen in Figure 1. Streamtraces still follow the airfoil shape as intended. As AoA is increased to 14° the initial onset of flow separation becomes apparent, indicating that stall is imminent. Following the streamtrace nearest the upper surface, at roughly ½-¾ chord the streamtrace noticeably deviates from the airfoil shape. Additionally, pressure contours at the trailing edge (TE) show fluctuations due to turbulence created by this separation region. Finally, flow separation envelopes the entire upper surface at 15° AoA. A large region of recirculating flow is prominent over the aft ½ of the airfoil. This dramatic change in the flowfield from 14° to 15° is indicative of aerodynamic stall, which can result in sudden degradation of aircraft performance and stability.
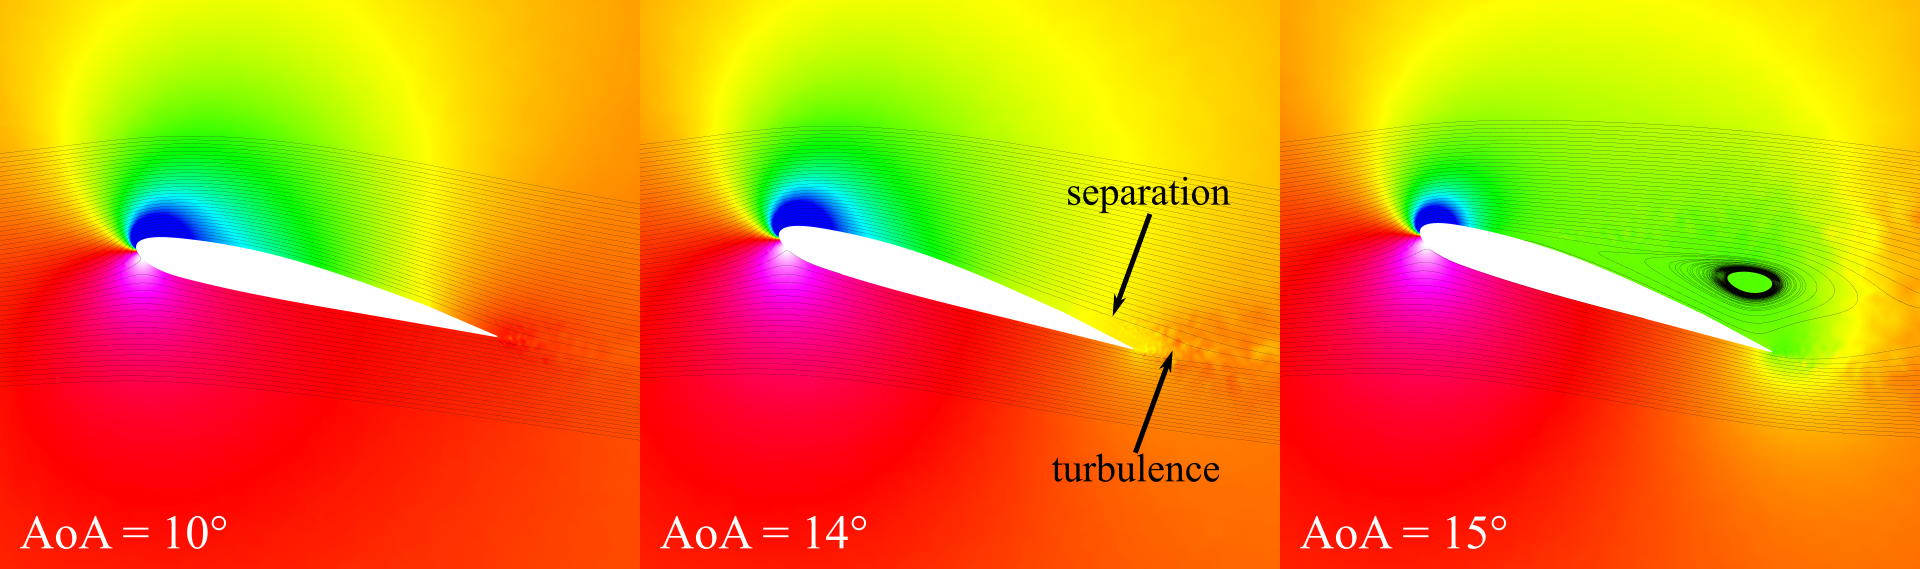
Figure 5 Progression of stall characteristics at increasing AoA.
ADDITIONAL FLOW PHENOMENA
Now that we’ve seen the basic flow phenomena associated with aerodynamic stall, let’s further investigate more complex features. The flowfield slices above essentially present two-dimensional steady-state flow around an airfoil. However, flow features around an aircraft approaching stall present many three-dimensional characteristics that are inherently transient. Aircraft stability can be severely impacted by these flowfield complexities that arise near stall conditions.
Visualizing surface streamlines (oil flow) on the upper wing highlights the localized effects of stall (see Figure 6). Contours of skin friction are also displayed where the presence of color indicates flow separation. The left figure at 14° AoA shows smooth flow in the streamwise direction along the outboard wing, but incoherent flow patterns inboard that indicate stall is imminent. Surface streamlines of the right figure at 15° AoA present four distinct recirculation patterns (stall cells) spanning most of the wing. The development of these flow features from inboard to outboard is a benefit of the C172 Skyhawk design; outboard control surfaces (ailerons) remain effective longer while approaching stall.
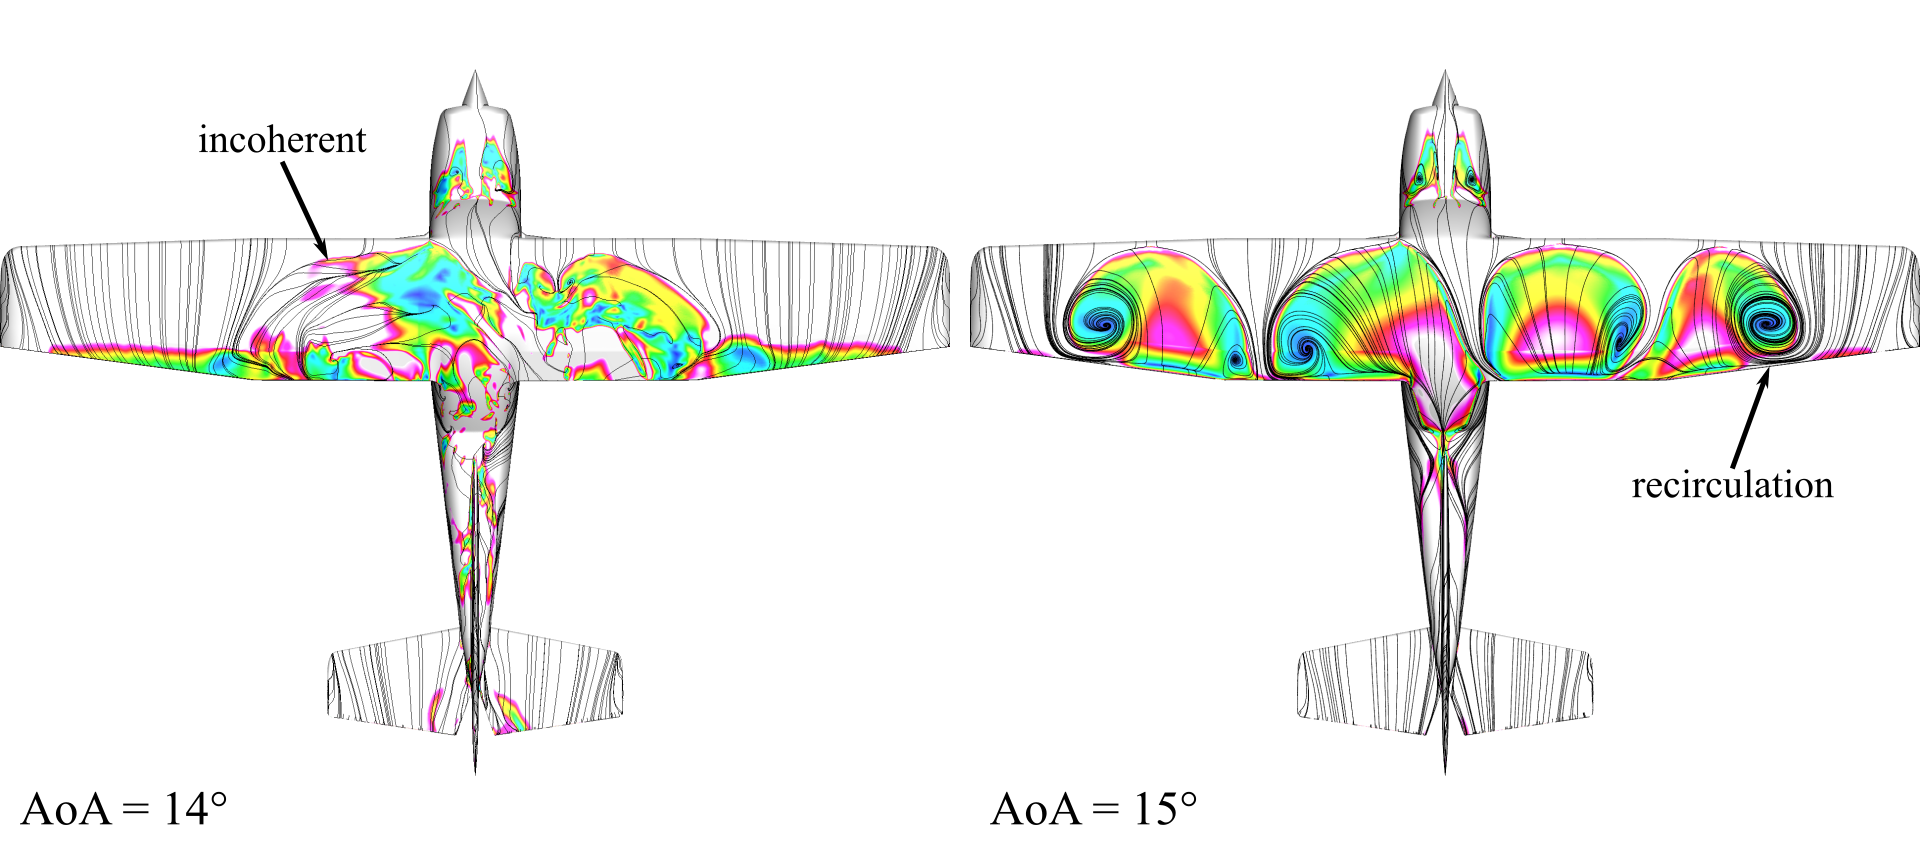
Figure 6 Top-down view of stall progression. Skin friction contours and surface streamlines displayed. The presence of color indicates flow separation.
As AoA approaches stall, these complex flow structures also vary in time. The video below displays the same surface streamlines and skin friction coefficient contours as above at 14° AoA. Local regions of separated flow move and change shape rapidly, inducing vibration of the aircraft and control instabilities. Additionally, asymmetric structures may lead to unintended roll and/or yaw of the aircraft which could further exacerbate the loss of control authority.
Figure 7 Transient behavior near stall. Regions of separation move and change shape rapidly.
Regions of separation, turbulence, and recirculation over a stalled wing are also not localized. Vortex structures propagate downstream of the wing and can directly impact aerodynamic characteristics at aft surfaces like the tail. Degradation of the horizontal and vertical stabilizers can potentially limit a pilot’s ability to recover from stall conditions.
Figure 8 Off-body flow structures. Iso-surfaces of Q-criterion colored by Mach contours displayed. Vortices propagate downstream and impact tail performance.
[1] Airplane Flying Handbook (FAA-H-8083-3B), Chapter 4.
FAA Airplane Flying Handbook