Monitoring Time History of Flow Variables
(Approximate reading time: 5mins)
In the recent release-22.3.3.0 of Flow360 a new point monitoring feature has been added to help users track time history of flow variables like velocity and pressure. This is a useful feature for acquiring physical quantities of interest in unsteady simulations as well as diagnosing solver divergence without dumping volumetric solution files frequently. Some applications of the feature include probing pressure on the wing surface to compare against pressure tap measurements and probing flow velocities at several distances away from the wall to measure boundary layer thickness.
Monitor Point Configuration
Monitor points are specified in the Flow360 case JSON file and can be organized into groups. Entries to define monitor points are simply the desired xyz-coordinates and output variables. Similar to other Flow360 data exports, the output primitiveVars will return density, pressure, and velocity components. Any parameter available in volume outputs can also be returned.
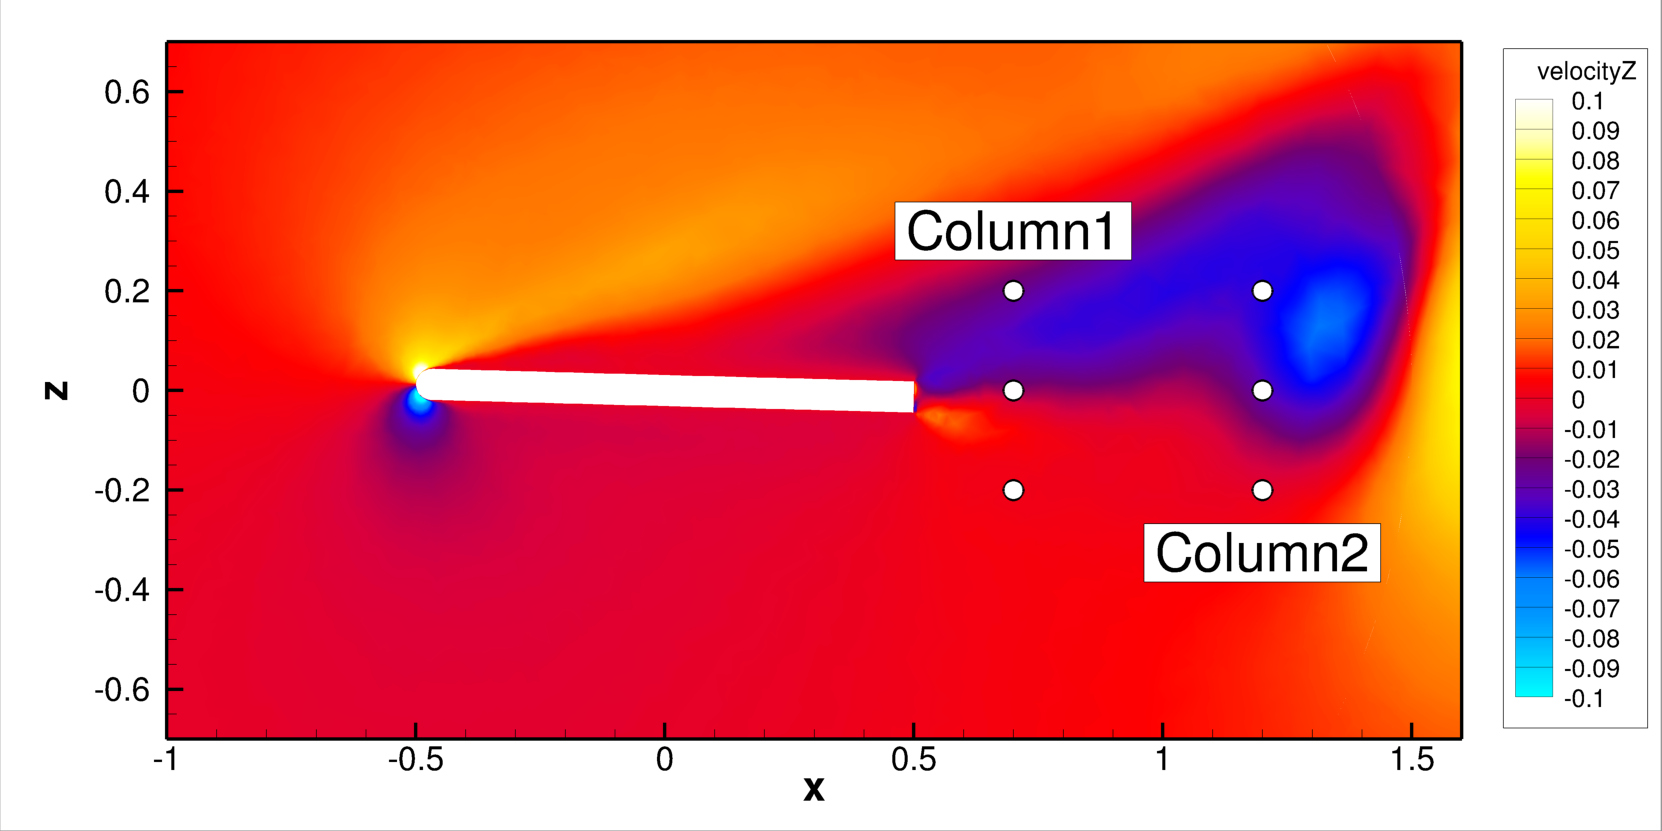
Groupings help users to catagorize the monitor points either by their locations or by their purpose. For example, we can place two groups of monitor points in the simulation domain named Column1 and Column2. Considering an isolated plate, Column1 could be an array of points placed aft of the trailing edge and Column2 placed downstream of Column1. Both groups can contain numerous points and probe various flowfield parameters. The example here is illustrated in the plot below:

Figure 1: Monitor point locations on a y-slice of the simulation domain.
Monitor Point Results
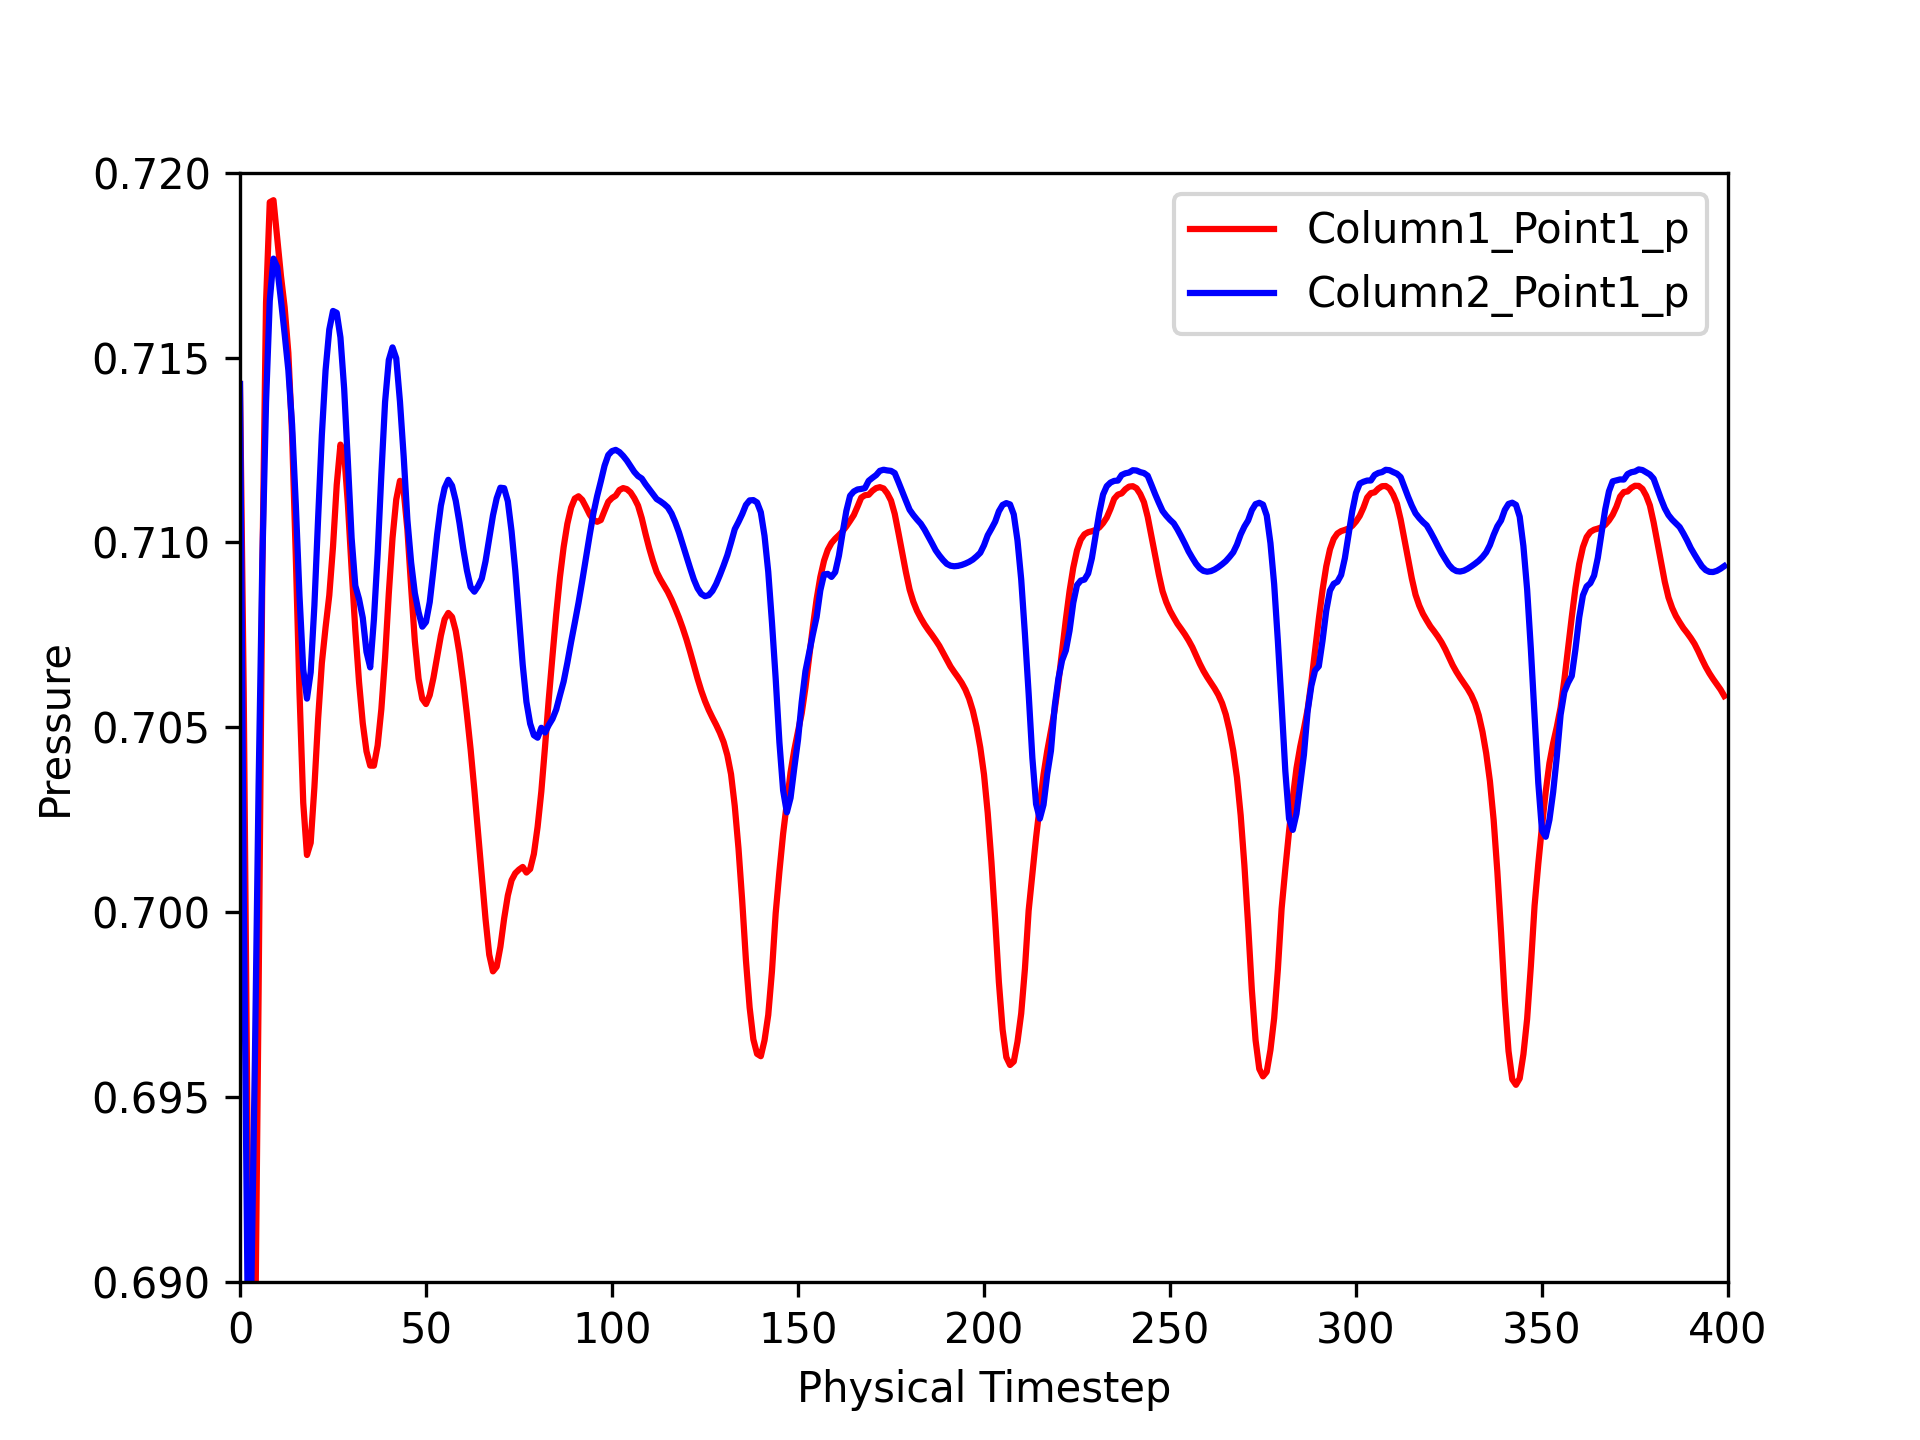
The probe results for each monitor group will be output to respective CSV files. Outputs for each monitor point in the CSV file is arranged in the same order as they are specified in the case JSON. For example we can obtain the pressure time histories using the above configuration and plot them below:

Figure 2: Pressure time history of monitor points.
The simulation presented above is of a plate pitching due to aerodynamic loads. Pressure oscillations introduced by the rotation of the plate can be clearly identified by both probed pressure histories. A phase shift due to the streamwise distance between the two columns of monitors is also visible.
Further details can be found in the Flow360 Documentation.


