Tiltrotor Propulsion Modeling with Blade Element Theory (Part 3 of 3)
In this series, we highlight our continued effort to study the fluid dynamics of the XV-15 tiltrotor aircraft. The full series consists of three parts: Part I provides some background on the need and utility of tiltrotor aircraft and summarizes the CFD study we carried out in 2021 using the Detached Eddy Simulation (DES) technique. Part II will discuss useful fluid dynamic propulsion approximations to model the XV-15 at a reduced computational cost. Part III will showcase the results obtained using the propulsion approximations.
##
In this final article of the series, we summarize the important results obtained when modeling the XV-15 isolated rotor in various configurations using Blade Element Theory (BET).
Model specifics
Before we move on to the results, let us briefly summarize a few key aspects of the simulations. The simulations were run in three modes as described in Table 1. In the Airplane mode, the propellers face forward, while in the Hover mode they are oriented facing up. For the Helicopter mode, the propellers are slightly tilted, providing lift as well as thrust.
Two meshes were used to generate the results, one for the propeller and hovering condition, and another for the helicopter condition. The helicopter configuration involves more complex physics; therefore we generated a larger mesh refined near the rotor to better resolve the wake and the blade-vortex interactions (in BET Line mode).
The lift and drag polars for the airfoil sections of the propellers were predicted using XFOIL assuming a chord Reynolds number of 5 million.
| Hover | Helicopter | Airplane | |
|---|---|---|---|
| Mtip | 0.69 | 0.69 | 0.54 |
| Re | 4.95e6 | 5.65e6 | 4.50e6 |
| θ75 | 0°, 3°, 5°, 10°, 13° | 2° to 10° | 26°, 27°, 28°, 28.8° |
| ⍺ | - | -5°, 0°, 5° | -90° |
| 𝜇 | - | 0.170 | 0.337 |
| nodes | 2.3M | 4.1M | 2.3M |
Effect of mesh refinement
We begin by performing a mesh refinement study. The results obtained from the BET Disk model at various mesh resolutions are compared against the DES results in Figure 1.
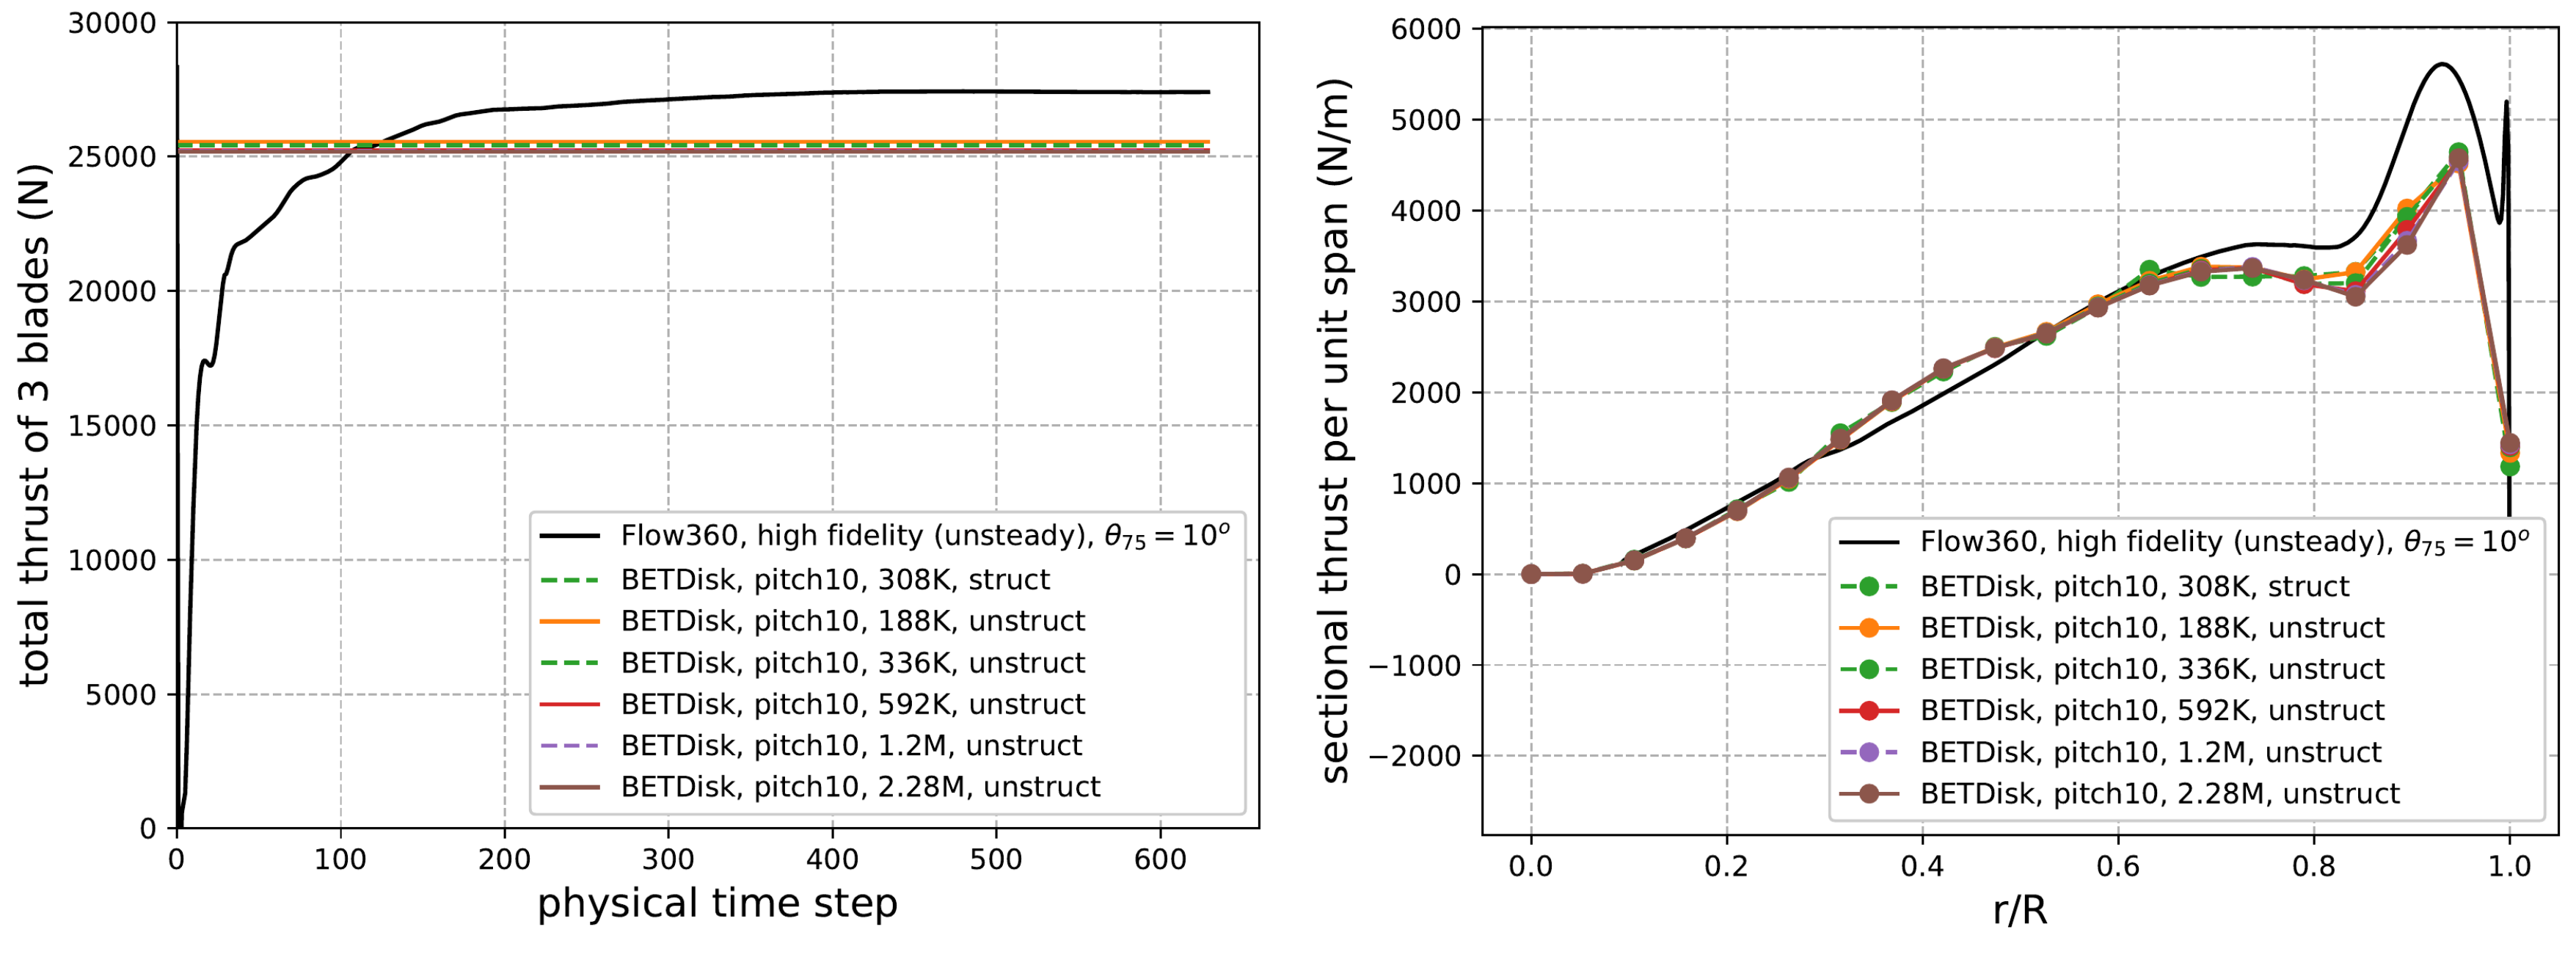
Figure 1: Behavior of total and sectional thrust for different mesh sizes.
The data shows that the thrust is relatively insensitive to the mesh coarseness. There is a 0.6% difference in the converged thrust between the finest and coarsest mesh. Furthermore, in the right panel, the 592K node grid shows little difference in loading compared to the finer mesh. However, we decided to run all cases using the finest grid since each case only requires a few minutes of runtime due to the speed of Flow360.
Airplane mode
Let us first discuss the Airplane mode where the blades are tilted fully forward. This should be the easiest operating condition to accurately simulate since in contrast with hover there is no blade and tip-vortex direct interaction.
We compute the steady-state solution using the BET Disk method, and use the BET Line method to compute the transient solution. The BET Disk simulations typically converge within 600 pseudo steps. The BET Line simulation is run for 10 revolutions, with a time step corresponding to two degrees per step. The forces stabilized well after 10 revolutions. Figure 2 shows the torque coefficient, CQ, and propulsive efficiency, η, as a function of thrust coefficient, CT.
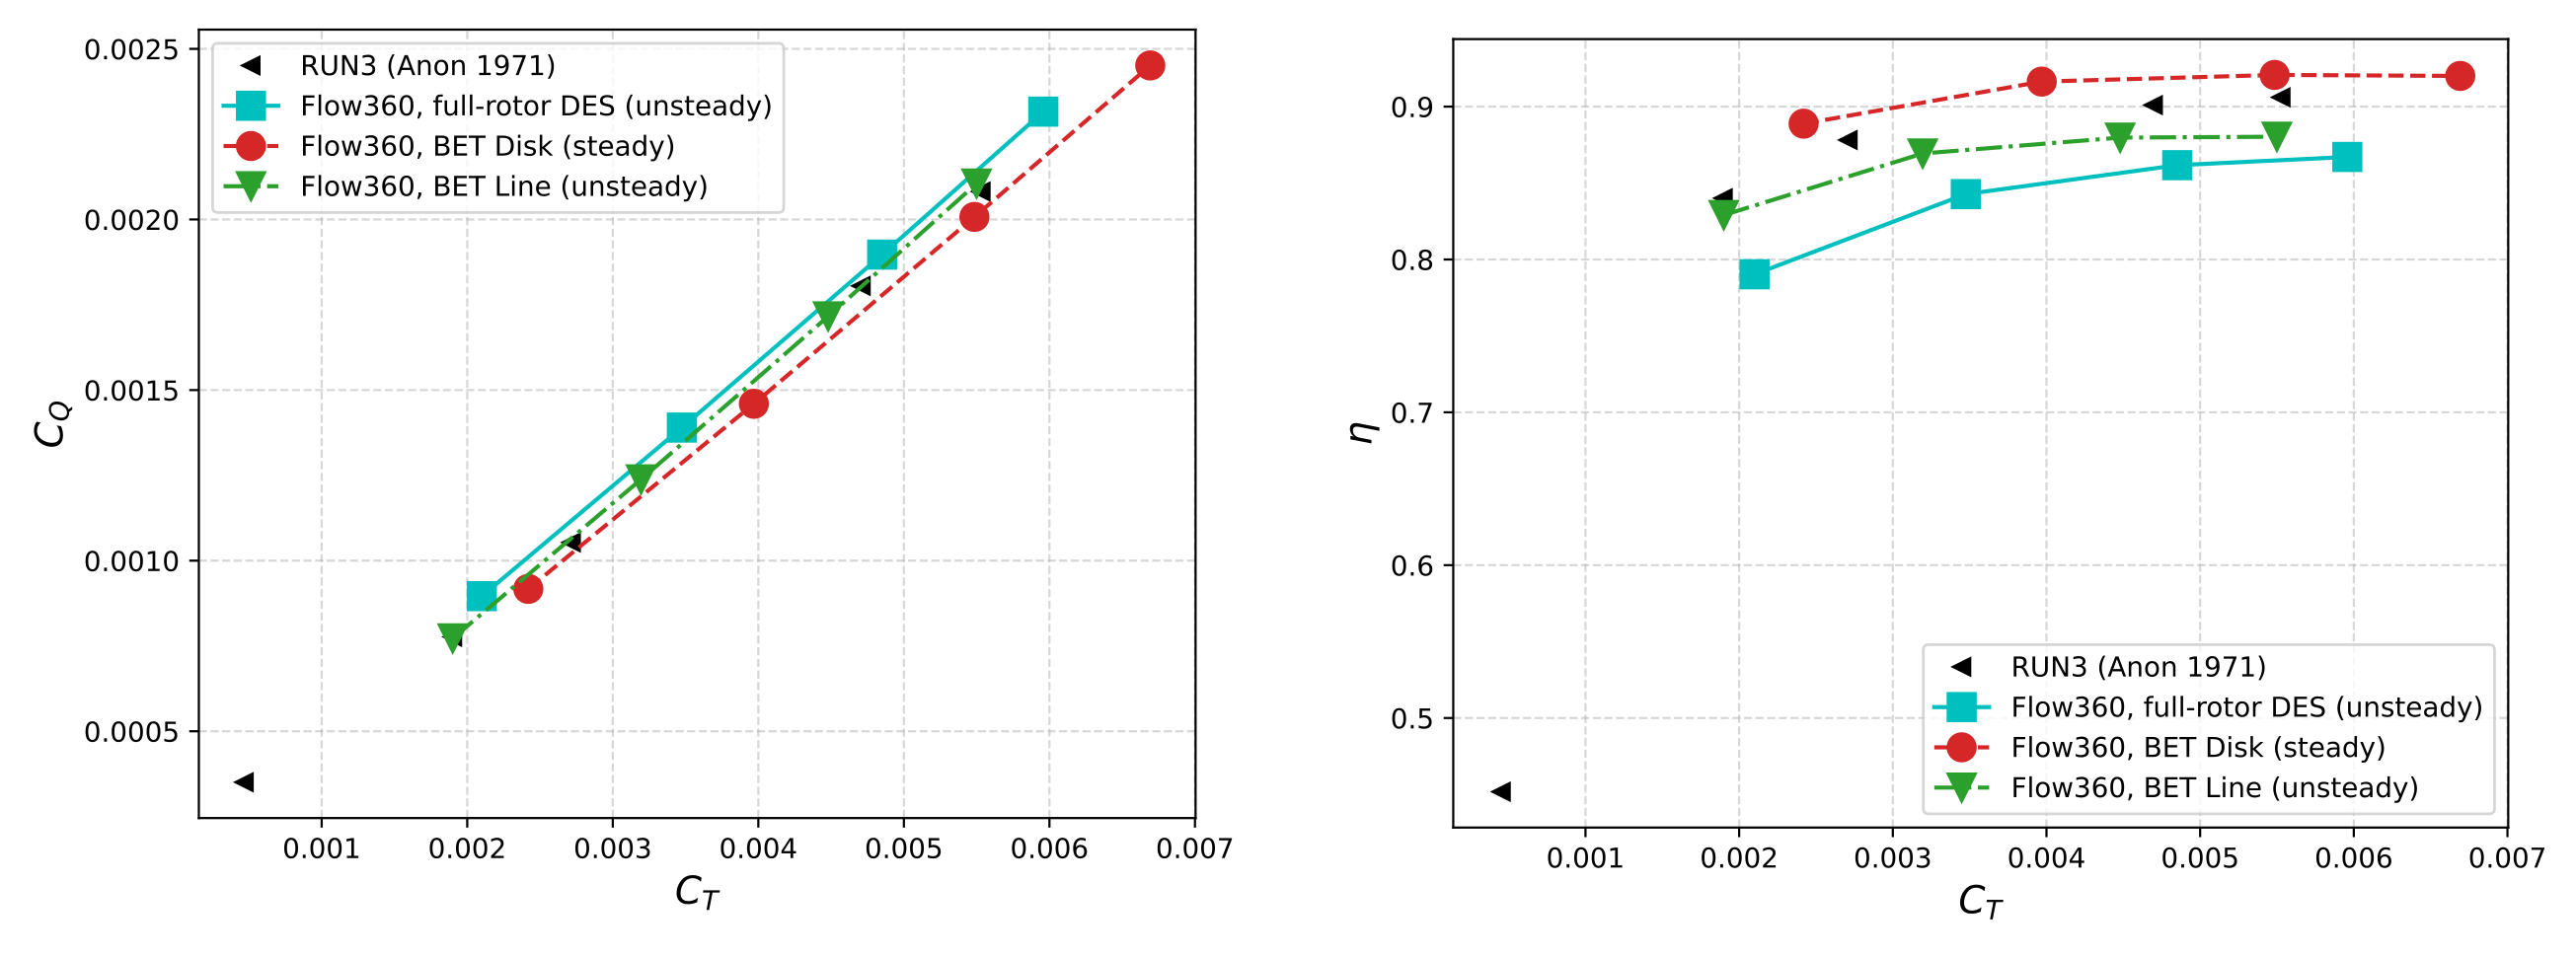
Figure 2: Behavior of CQ and η as a function of the thrust coefficient CQ. The four points for each model are calculated at θ75 of 26°, 27°, 28°, 28.8°.
The data shows good agreement between both BET models as compared to the high-fidelity DES results. The BET Disk method slightly over-predicts both thrust and torque compared to the DES, whereas the BET Line method under-predicts both thrust and torque. Furthermore, the BET Disk method over-predicts efficiency, η, compared to both experiment and DES, while the BET Line method predicts efficiency between the experiment and DES. All modeling approaches generally align with trending of the experimental results.
Figure 3 shows the sectional thrust loading for all pitch conditions simulated in airplane mode.
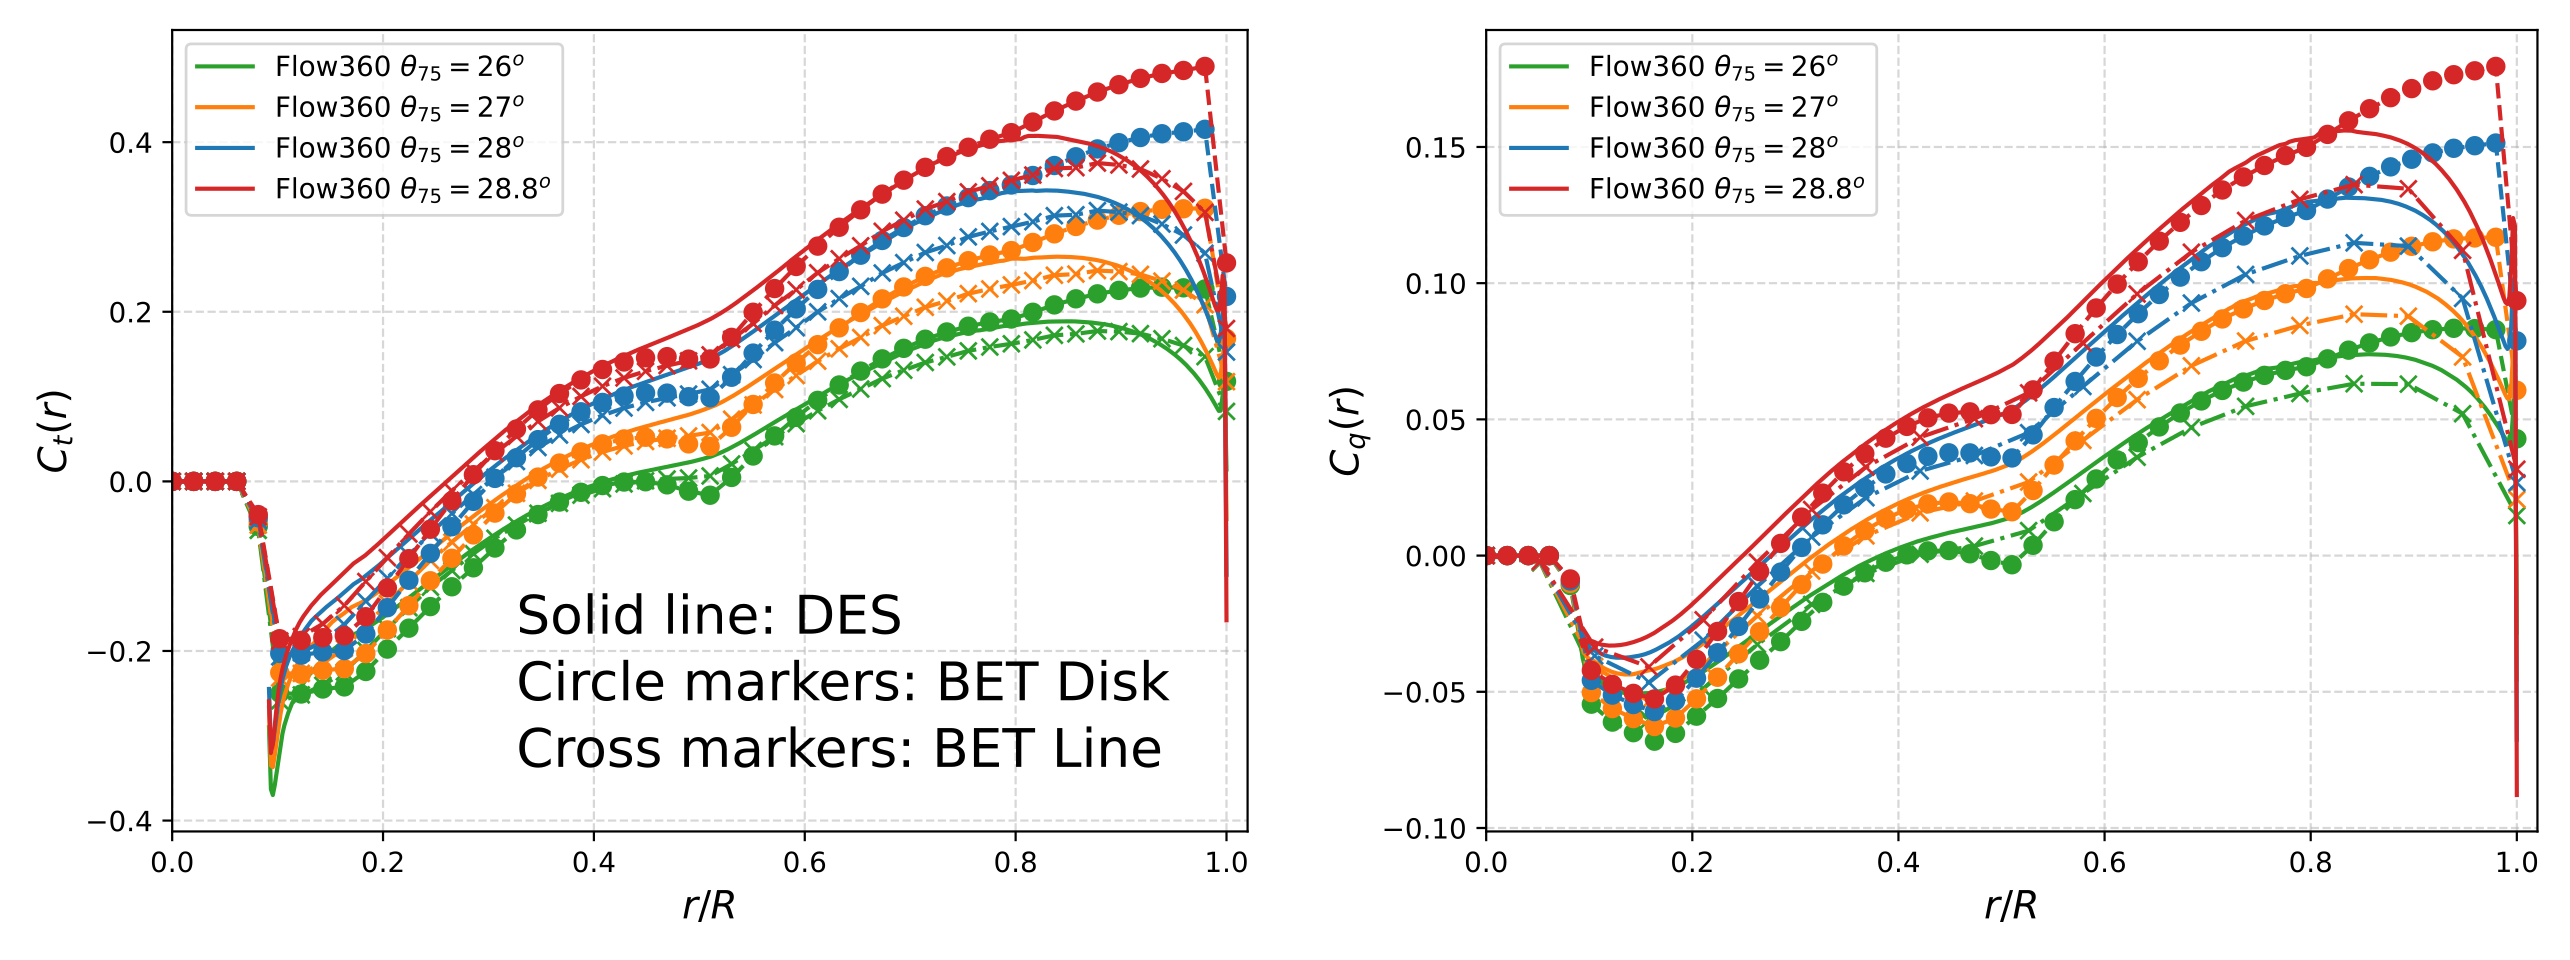
Figure 3: Behavior of sectional thrust and torque loading for different cases in Airplane mode.
The steady-state BET Disk method severely over-predicts the thrust loading near the tip, whereas the transient BET Line method tends to under-predict the thrust loading in the mid-blade region compared to DES. A similar trend persists in the case of the torque loading. The BET Disk issue is plausibly due to its failure to incorporate the tip vortex of the preceding blade, as seen in a figure from Part 2. That vorticity is instead represented simply by an axisymmetric vortex sheet.
Hovering mode
The hovering flight condition presents even more of a challenge for lower-fidelity methods, since there are often blade-vortex interactions and highly three-dimensional effects. Figure 4 shows the variation of Figure-of-Merit (FoM), calculated as a ratio of (CT)3/2 and CQ√2, as a function of CT for the hovering condition.
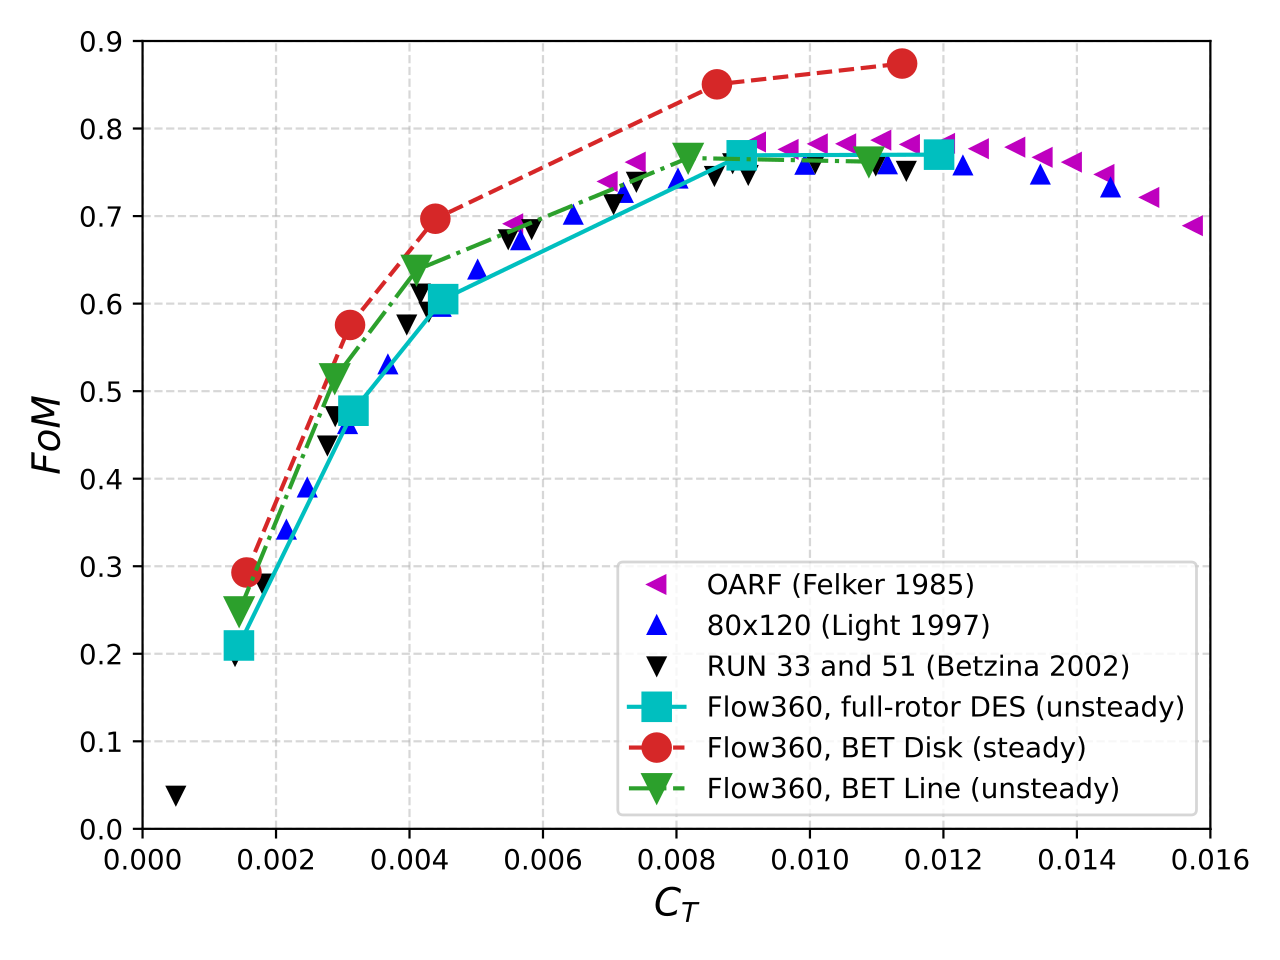
Figure 4: Variation of Figure-of-Merit versus the thrust coefficient for Flow360, earlier simulations, and experimental data.
The BET Disk method over-predicts the FoM by as much as 10% (due to under-prediction of the torque). The BET Line method also slightly over-predicts efficiency at lower blade loadings, but is in line with the high-fidelity and experimental efficiency for larger blade loadings.
The sectional thrust and torque loadings shown in Figure 5 reveal very good agreement in sectional thrust loading between the BET Line and high-fidelity DES methods. The surge at about 90% radius is attributed to the vortex from the preceding blade. At higher blade loadings, differences appear near the tip, in the last 20% of the blade. Again, BET Disk maintains high local loading essentially all the way to the tip.
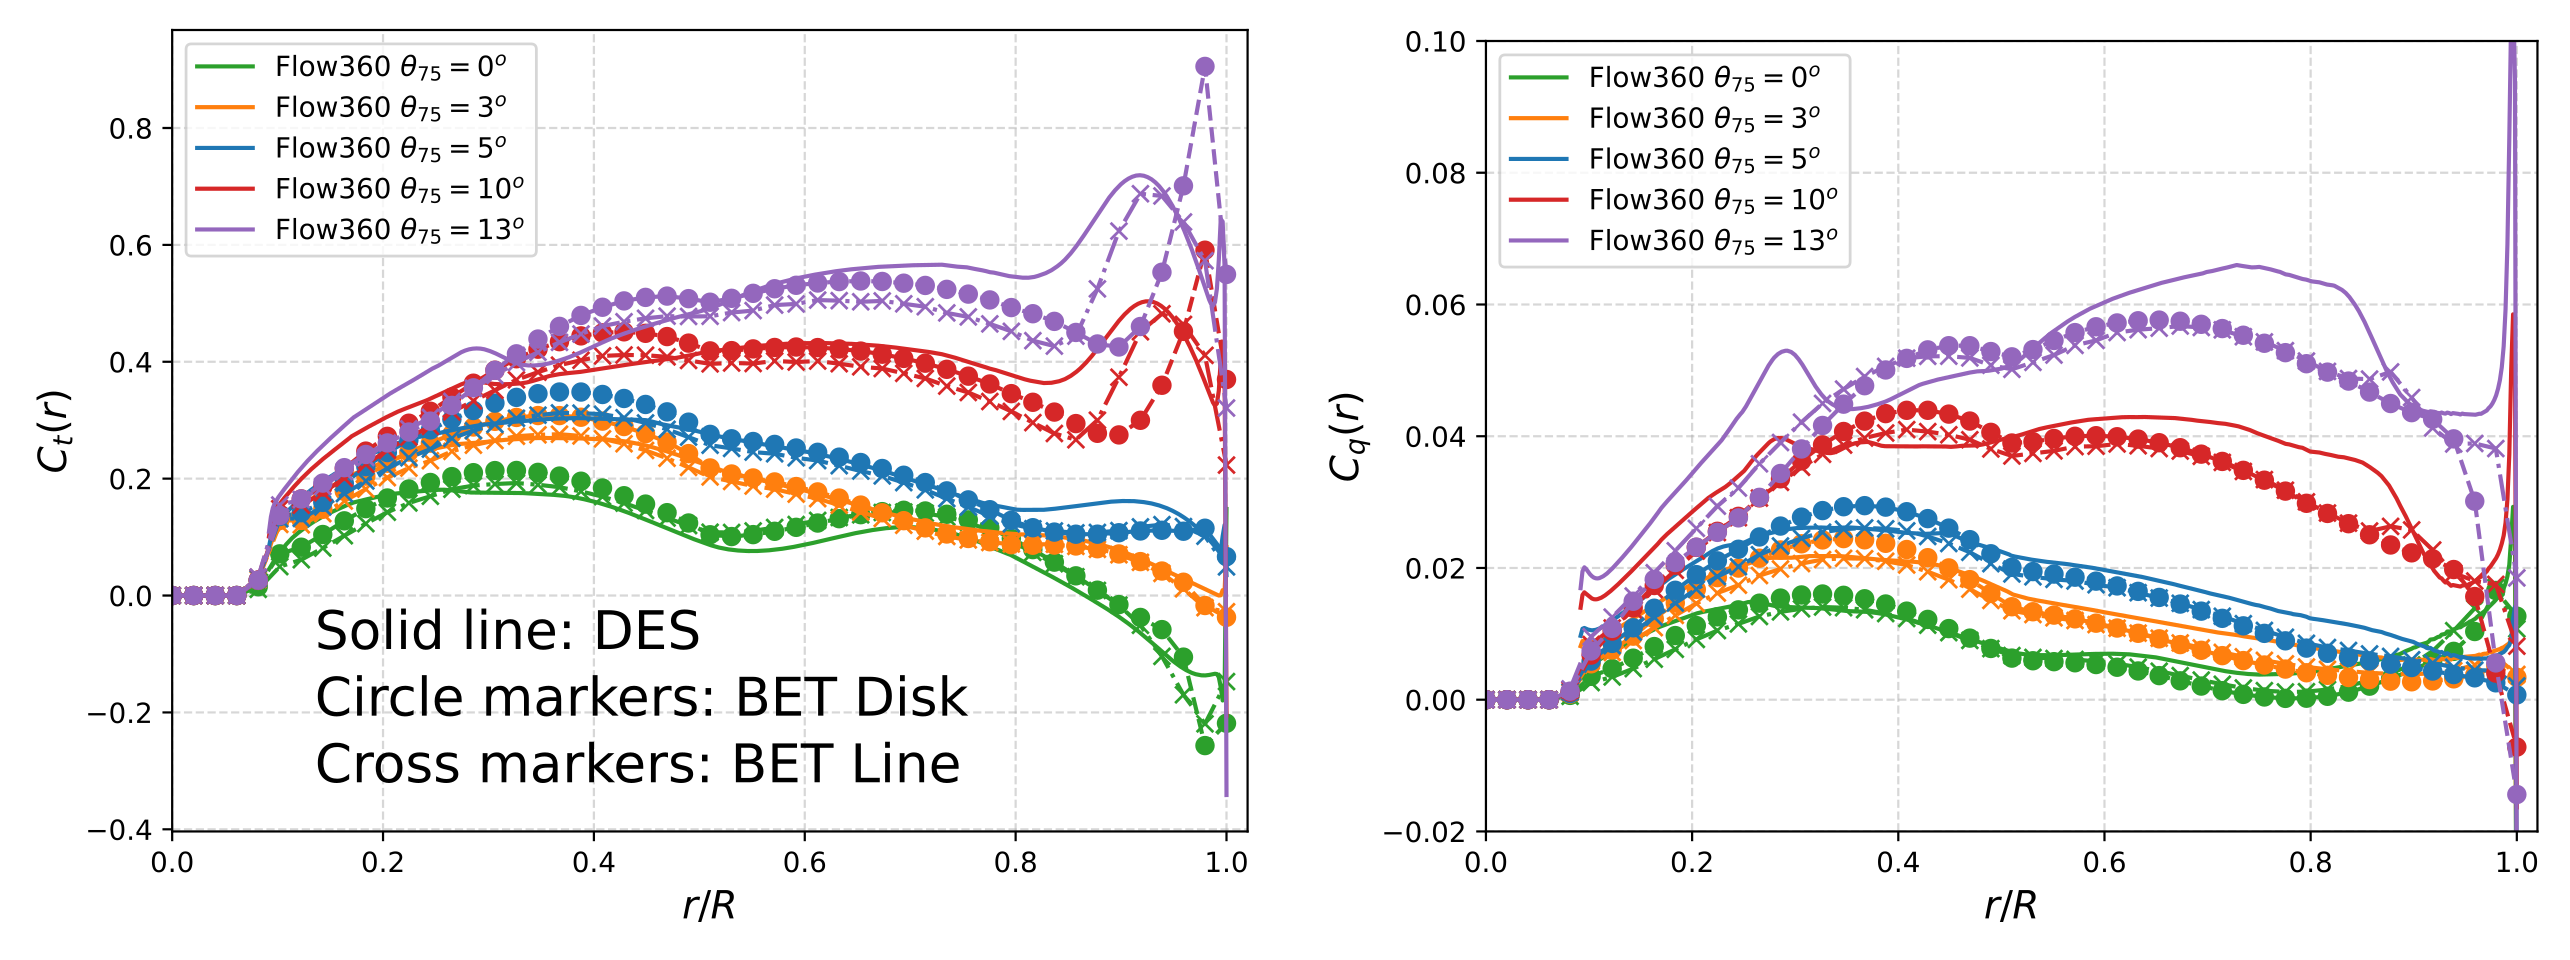
Figure 5: Behavior of sectional thrust and torque loading for different cases in Hovering mode.
Notably, the BET Disk method over-predicts the thrust at the blade tip. The BET Line method is more in-line with the DES loading, although it tends to under-predict the thrust coefficient around 85% radius. This mismatch is caused by the highly three-dimensional nature of the flow in that region, due in part to the leading blade’s tip vortex strongly interacting with the blade.
As for the sectional torque loading for the three methods, again reasonable agreement is seen between all models for lower blade loadings. However, for higher loadings, both the BET Disk and BET Line under-predict torque, especially at r/R > 0.5. A possible reason for the under-prediction of torque in this region is the use of incompressible airfoil polars in the BET lookup tables. Although, we cannot consider the DES results to be perfect; it is only our most complete description.
Helicopter Mode
The most challenging condition to simulate is the Helicopter mode due to the complex blade-vortex interactions. This flight condition is characterized by a forward velocity with the axis of rotation close to perpendicular to the forward velocity, but typically with some incidence angle, α. A positive alpha results in the freestream flow entering the disk from below, and is typical of a descending condition. A negative alpha results in the freestream entering the disk from above, as is typically the case for level forward flight or ascending flight.
As shown in Figure 6, the BET Disk method again underpredicts CT and CQ significantly compared to experiments and DES, although CQ to a greater extent. The BET Line method predicts slightly less thrust than the BET Disk method, but the torque is closer to high-fidelity results, especially for smaller pitch angles. The agreement between DES and BET Line is close to engineering accuracy. These trends persist in the α = 0° and 5° cases (not shown).
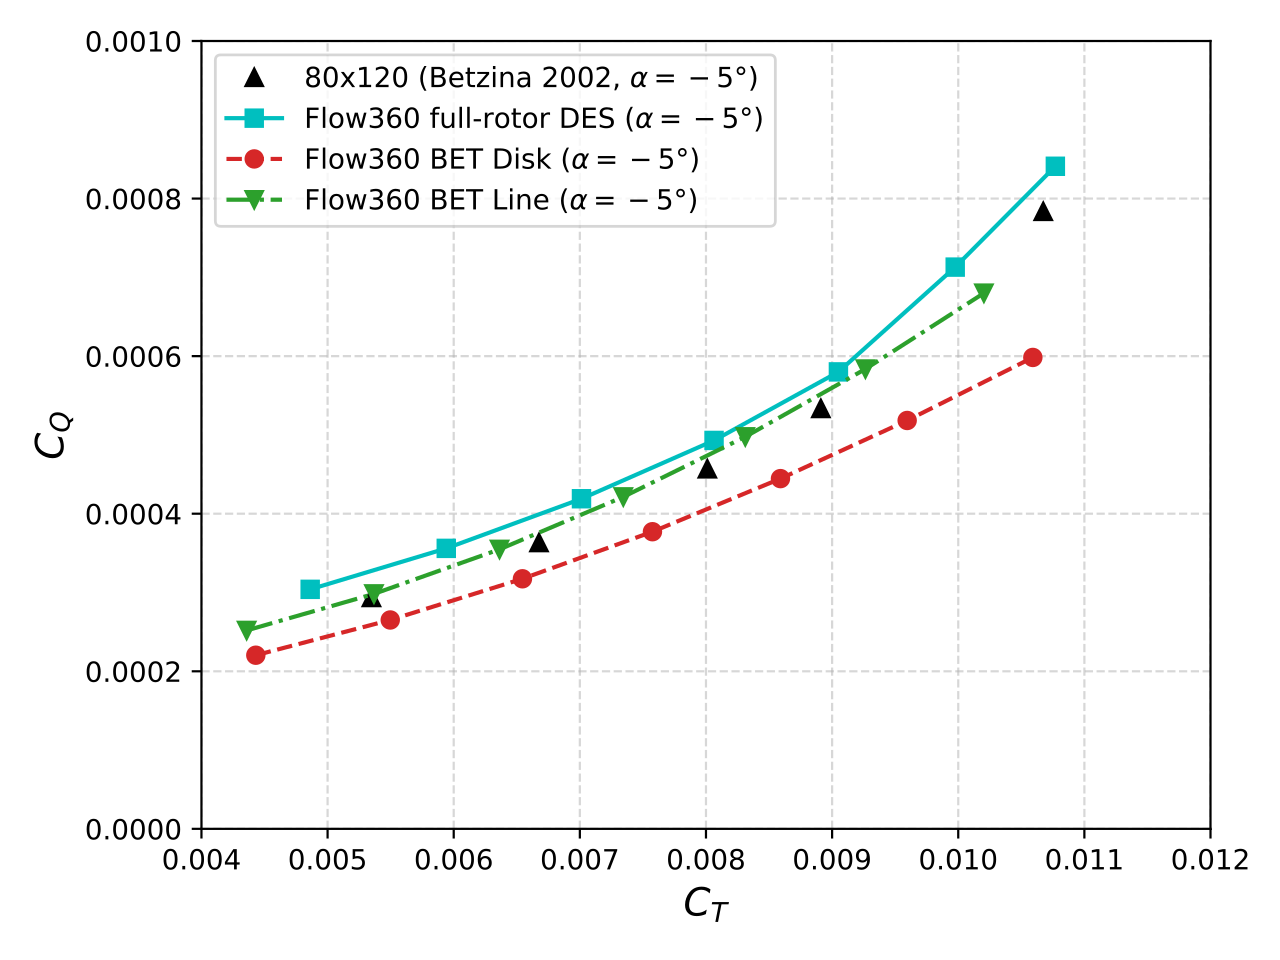
Figure 6: CQ as a function of CT for Flow360’s DES and BET models. Also shown are existing experimental data. The α is -5° and the different data points for each model correspond to several pitch angles.
The blade thrust and torque loading distributions were compared to assess differences between the BET Line model and the high-fidelity DES results. It can be observed in Figure 7 that there is a discrepancy along the inboard section of the blade. This area of the blade is subject to large degrees of radial flow in DES, which may not be accurately modeled by the BET Line method. The behavior was similar for the sectional torque coefficient Cq.
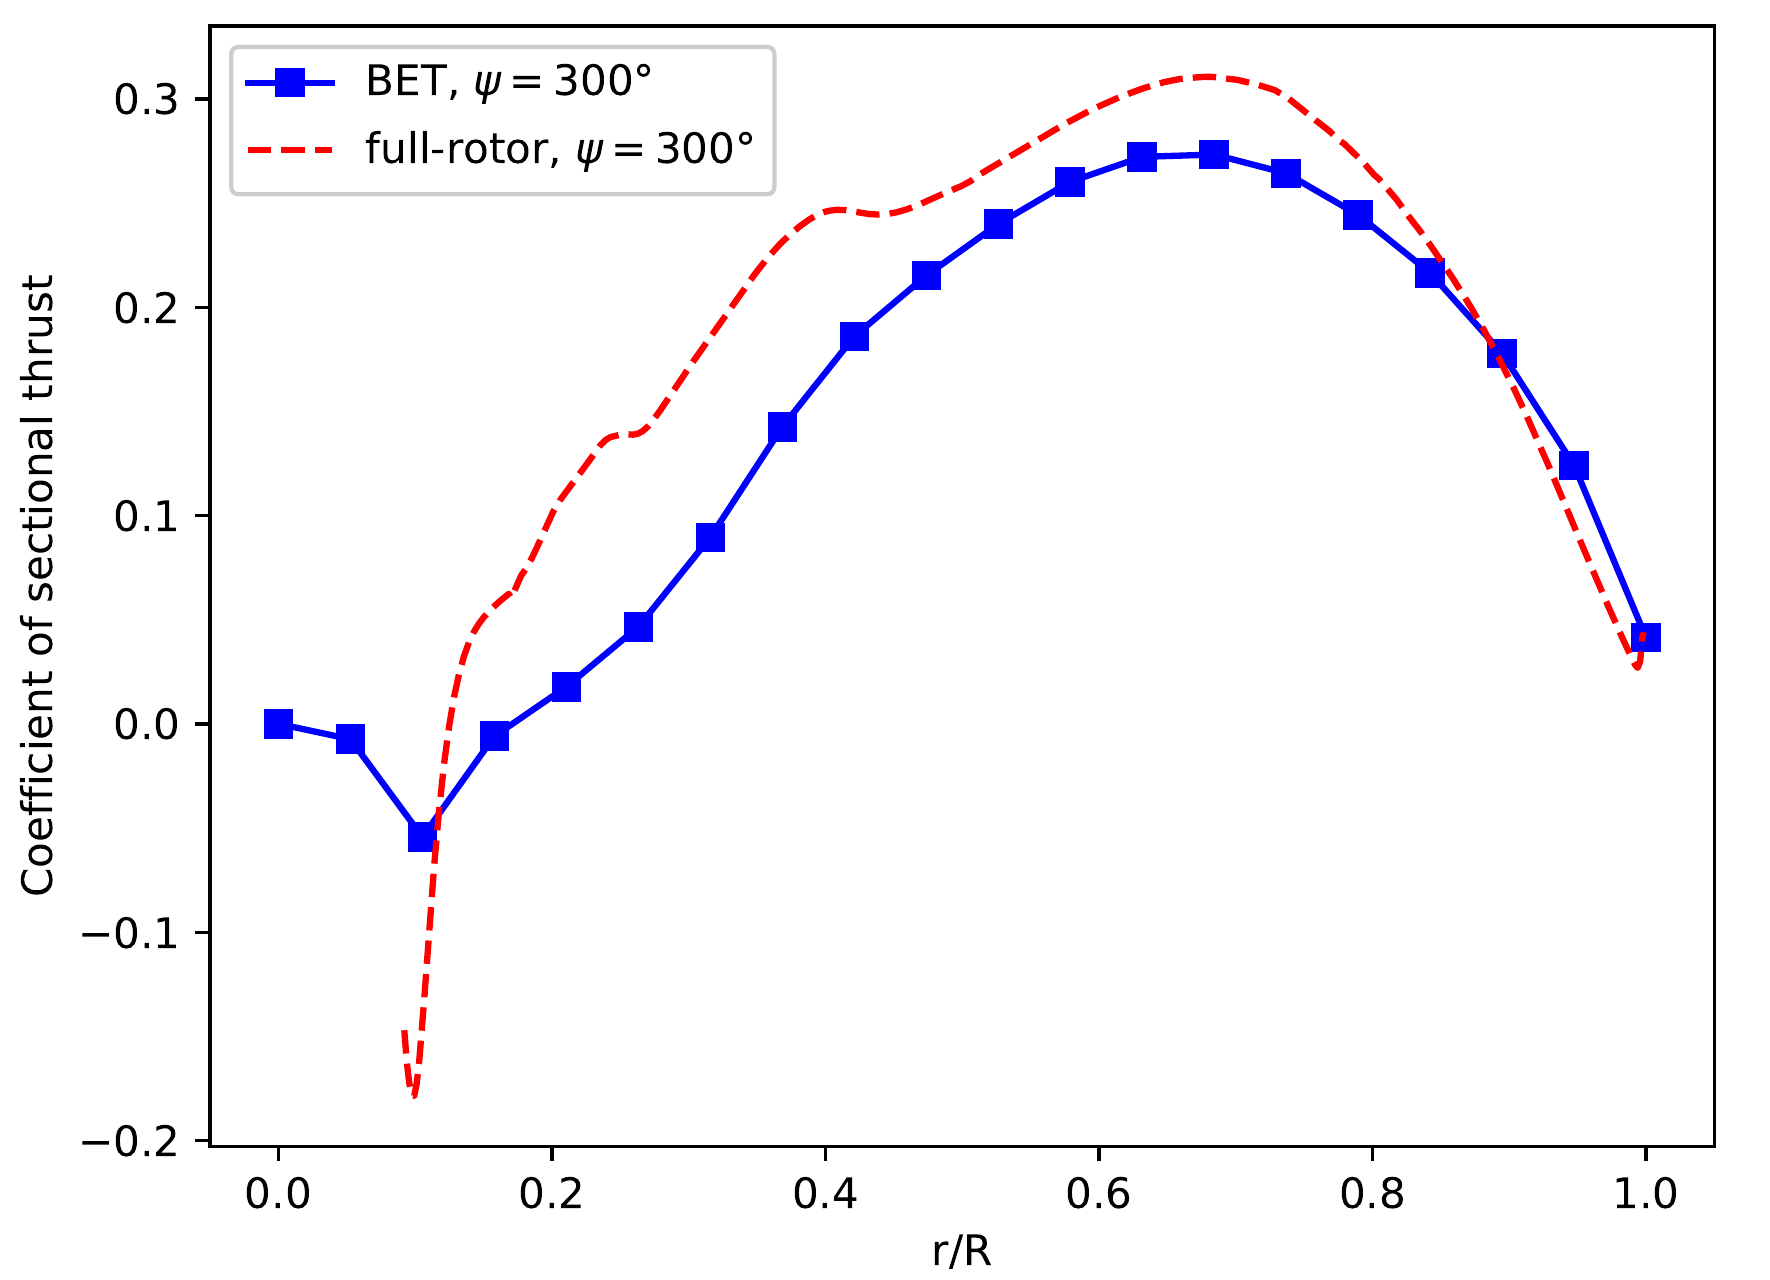
Figure 7: The distribution of Ct along blade 1 in Helicopter mode.
Flow in BET Line vs DES
Finally, let us visualize the 3D flow field around the rotor blades in the case of BET Line and DES models to visually compare the two approaches.
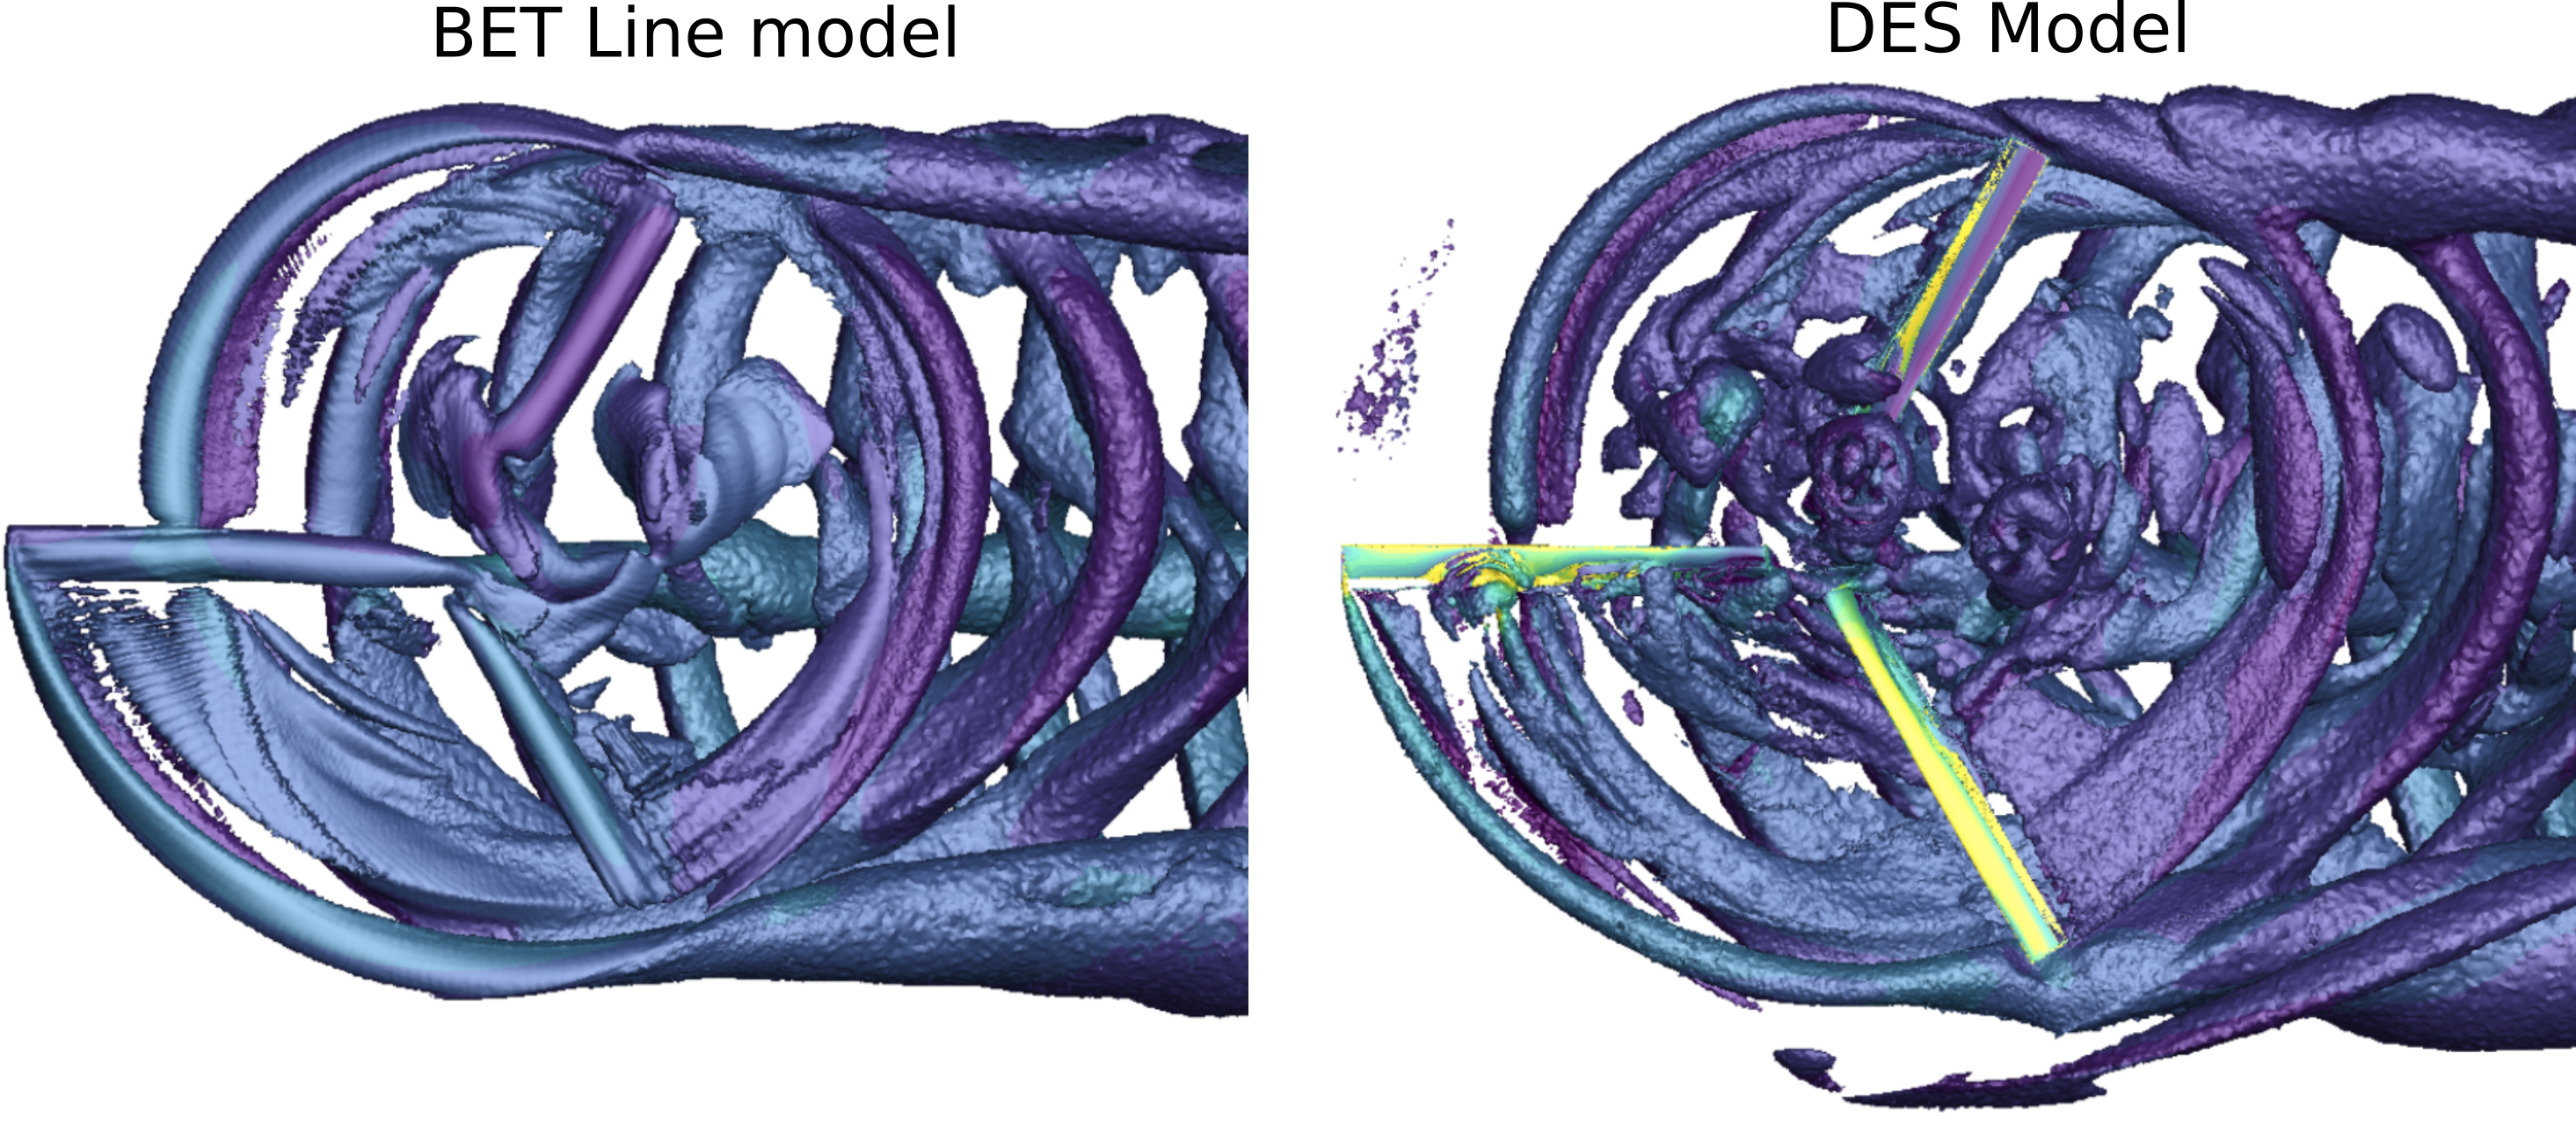
Figure 8: Q-criterion isosurface comparison of Flow360’s BET Line and DES simulations. The simulation was performed at α = -5°(forward flight possibly with climb) and θ75 = 10°.
Figure 8 shows that the shed vortices interact with the other blades and convect downstream very similarly between the two methods. The forward blade clearly cuts the vortex of the preceding blade. There are differences in the vortex structures near the blade root; however, this region of the rotor has only a small effect on overall rotor performance due to its low rotational velocity. The vortices are thinner with DES, thanks to a smaller eddy viscosity.
Conclusions
We arrive at the following important conclusions after our analysis of the BET and DES modeling of XV-15:
1. Both the BET Disk but especially the BET Line methods show good agreement in terms of CT and CQ with both experimental data and previous high-fidelity CFD results.
2. Accuracy of the sectional loading coefficients for BET methods compared to high-fidelity DES shows some discrepancies, especially near the tip where the flow is highly three-dimensional.
3. The runtime for the BET Disk method is approximately two orders of magnitude lower than that for a full DES run, while the runtime for BET Line is approximately one order of magnitude less than high-fidelity. Therefore, each of these BET methods offers a good compromise between accuracy and cost, and may be favored at different stages of the design cycle.
This concludes our series of articles on the efficacy of Blade Element Theory in simulating the XV-15 rotor! It is clear that we can use the BET modeling approach to achieve tremendous savings in computational time without compromising the accuracy of results substantially.
If you’d like to learn more about CFD simulations, how to optimize them, or how to reduce your simulation time from weeks or days to hours or minutes, stop by our website at Flexcompute.com or follow us on LinkedIn.
For the expanded version of the paper this content is derived from, click here.

